

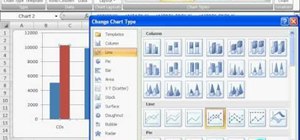
In this software video tutorial you will learn how to create a column line graph in Microsoft Excel 2007. First you type in the data in to the work sheet. Then highlight the data and click 'insert' on the menu bar. Here you select the 'column' option and go down and click on the type of column that you want. And the graph is automatically presented. Now click on 'move chart' and select a sheet where you want the graph to be moved to and click OK. To change any field in the chart in to a line graph, click on the field and click on 'change chart type', select the 'line' option, select the line type and click OK and it is converted in to a line graph.
Just updated your iPhone? You'll find new emoji, enhanced security, podcast transcripts, Apple Cash virtual numbers, and other useful features. There are even new additions hidden within Safari. Find out what's new and changed on your iPhone with the iOS 17.4 update.


Be the First to Comment
Share Your Thoughts