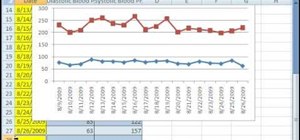
In this video the instructor shows how to create charts and graphs in Microsoft Word. First, open the Word document and select an area to insert the charts. Now go to the Insert tab in the ribbon and select the Chart icon. The Insert Chart window opens up with various chart templates. There are various categories of charts like Line, Pie, Bar in the left hand side. In the right hand side you can see the sample charts available and you can select any of them that you want. Now it transfers you into an Excel spreadsheet where you can format the columns and enter data in that table, and this will be reflected in the chart in the original document.
This video shows how to create charts in Microsoft Word 2007.
Just updated your iPhone? You'll find new emoji, enhanced security, podcast transcripts, Apple Cash virtual numbers, and other useful features. There are even new additions hidden within Safari. Find out what's new and changed on your iPhone with the iOS 17.4 update.









Be the First to Comment
Share Your Thoughts