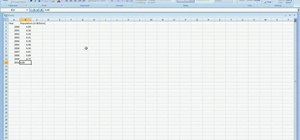
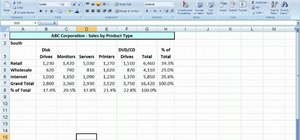
In excel a left click is made on box A1 and the X title is typed in as year. In A2 the year 2001 is typed and in A3 the year 2002. Both A2 and 3 boxes are highlighted and the bottom right hand corner is used to drag the work into a copied sequence down to A12. In B1 "population in billions" is typed. From the web site the data is copied and typed in as it appeared and the numbers are rounded off. A click is made on the "insert" tab and line is selected from the menu which appears. The upper left graph is then selected. A blank box appears and a right click is made and the "select data" option is clicked on. The new box entitled "select data source" within which legend entry series is appears, the "add " button is clicked; a dialogue box appears, containing an edit series option. In the series name box population in billions is typed in and the series value is deleted. A drag is made from box B2 to 12, which appears in the sequence in the series values box , then ok is clicked. A horizontal category axis labels appears and edit is clicked and a new dialogue access box appears. A click and drag is done from box A2 to 12 and ok is selected. The select data source dialogue box reappears ok is clicked again.
Just updated your iPhone? You'll find new emoji, enhanced security, podcast transcripts, Apple Cash virtual numbers, and other useful features. There are even new additions hidden within Safari. Find out what's new and changed on your iPhone with the iOS 17.4 update.





Be the First to Comment
Share Your Thoughts