

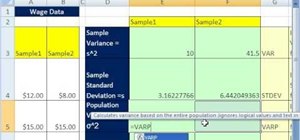
If you use Microsoft Excel on a regular basis, odds are you work with numbers. Put those numbers to work. Statistical analysis allows you to find patterns, trends and probabilities within your data. In this MS Excel tutorial from everyone's favorite Excel guru, YouTube's ExcelsFun, the 41st installment in his "Excel Statistics" series of free video lessons, you'll learn how to calculate deviations, variance and standard deviation for a sample and a population using Excel tables and the VAR, STDEV, AVERAGE, VARP, STDEVP, COUNT and SQRT functions. Learn about how the standard deviation is like an average of all the deviations, how it shows how clustered the data points are around the mean, how it helps to find out if the mean fairly represents its data points.
Just updated your iPhone? You'll find new emoji, enhanced security, podcast transcripts, Apple Cash virtual numbers, and other useful features. There are even new additions hidden within Safari. Find out what's new and changed on your iPhone with the iOS 17.4 update.


Be the First to Comment
Share Your Thoughts