


Given a function, you can easily find the slope of a tangent line using Microsoft Excel to do the dirty work. That is to say, you can input your x-value, create a couple of formulas, and have Excel calculate the secant value of the tangent slope. This is a fantastic tool for Stewart Calculus sections 2.1 and 2.2.
Note that you can essentially enter the exact same functions into Google Sheets as well as Excel, so this is a great tool for either option. So if you have a Windows or Mac machine with Excel installed, use that. If you're running a Linux distro or Chrome OS, or would rather use a free tool, use Google Sheets.
Getting Started
For this example, we'll use the following function:
To translate, we want the to find the slope of the tangent line of the function 2+SQRT(x) where x=1.

Find the Y-Coordinate
Using the formula, it's quite simple to find the y-coordinate based on the x-value. For example, for x=1, the y-coordinate would be F(1)=2+SQRT(1), leading to a value of 3.

Secant Lines
Now we'll need to use points both before and after the x-value that approach that value, but never reach it (purple line below). Plotting these points on the graph will create the secant line for the formula.

Now it's time to start plotting. We'll start with hand calculations before moving on to using Excel (or Sheets) to automate the process.
We'll need to plot points for the x-value, the y-value, and the secant slope.

As you can see above, with x=2, the y-value is 3.4142 (using the formula). The secant slope is calculated by taking the difference in the y-value and dividing it by the difference in the x-value, which is 0.4142.
Automate Y-Value with Excel
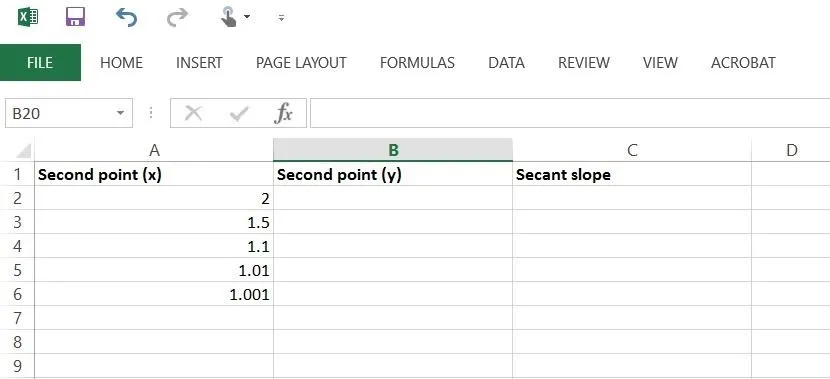
Recall that we want the x-value to approach 1 without ever reaching it. So, we can use 2, 1.5, 1.1, 1.01, and 1.001. You'll also want to do this coming the other way, so we can use 0, 0.5, 0.9, 0.99, and 0.999.
Start by labeling the columns, then enter your x-values. We'll start with 2 as it approaches 1.
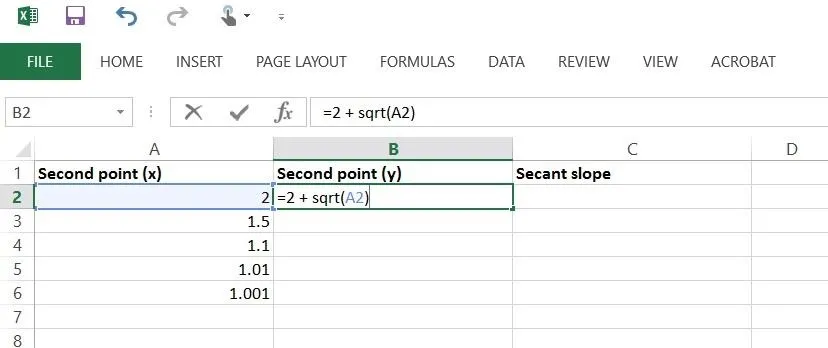
Now enter the formula to calculate the y-value. In the second column, input "=2 + sqrt(A2)" where A2 is the box where the x-value is stored (you can enter "A2" manually, or simply click the box that contains the value), then hit enter.
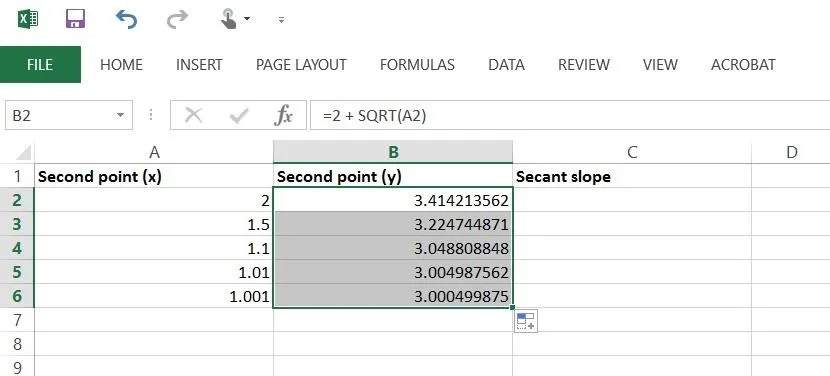
Now click on the box that you just entered the formula into, then drag from the bottom-right of that box down to the final x-value to insert the formula into each one—you'll notice the y-values pop up.
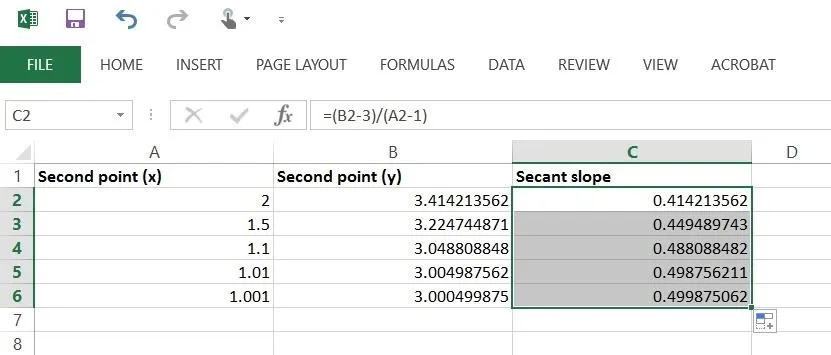
Automate Secant Slope with Excel
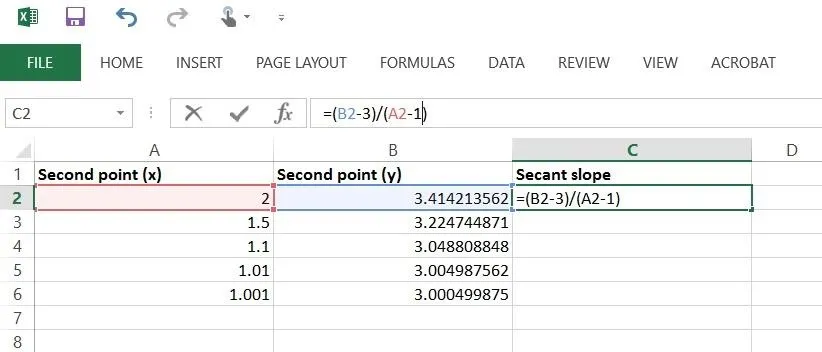
Now in the third column, let's enter the formula to calculate the secant slope. The formula here is "=(B2 - 3)/(A2 - 1)" (again, you can simply click on the boxes that hold the value).
Just as before, drag down from the bottom-right to apply the formula for the rest of the x- and y-values.
Calculate for X-Values from 0 Approaching 1
Now just rinse-and-repeat, using x-values going the other way. Apply the same drag technique for these.
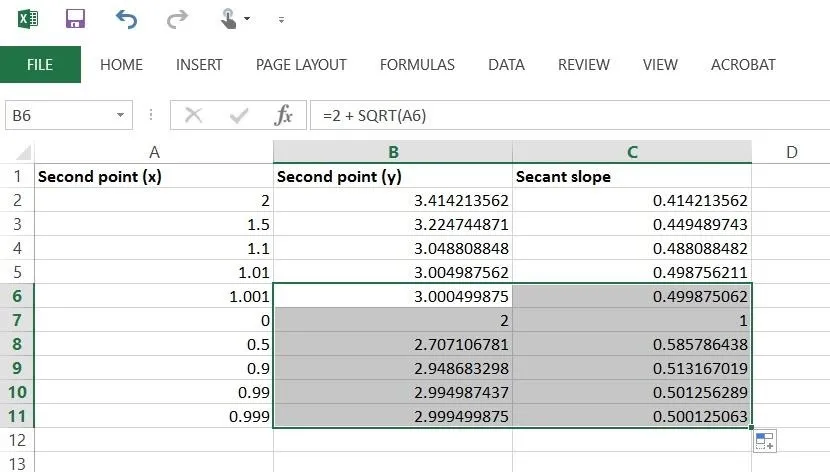
There you have it, the secant slopes for this formula when x=1. For a further detail, check out the video below.
Screenshots via WonderHowTo unless otherwise noted


Comments
Be the first, drop a comment!