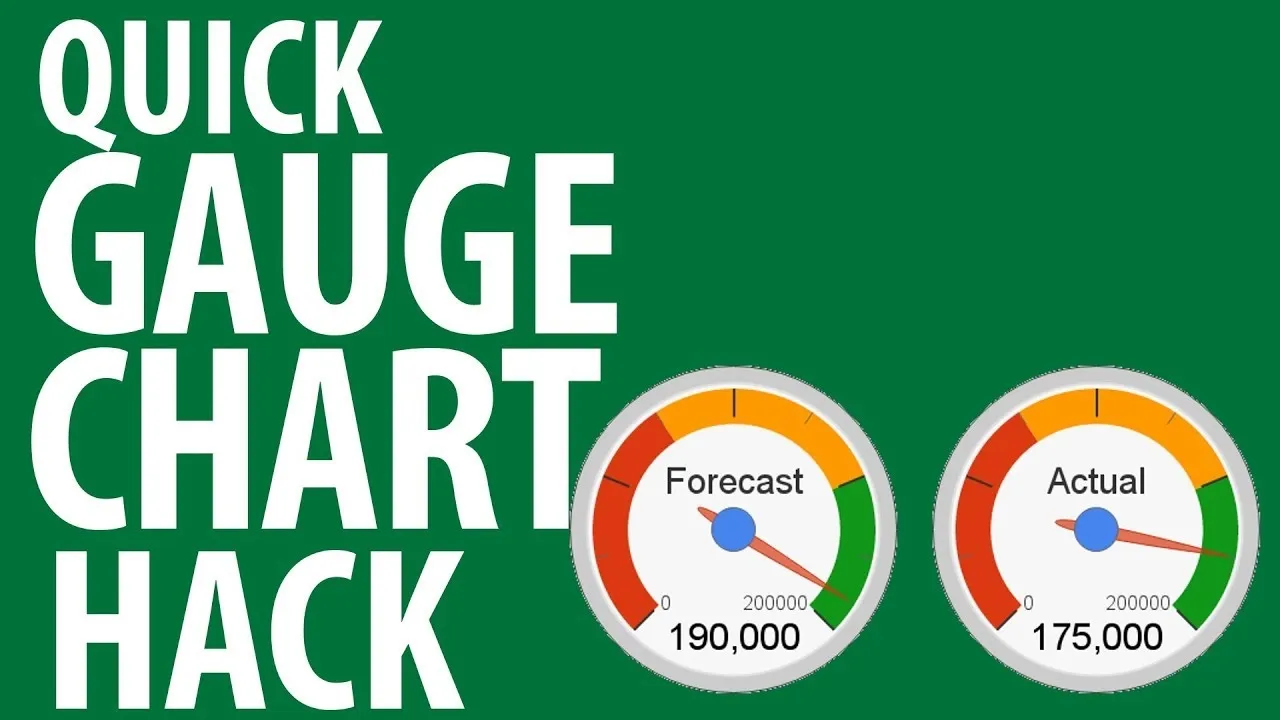
Check out this tutorial and learn how to create chars in Excel 2007. In Office Excel 2007, you just select data in your worksheet, choose a chart type that best suits your purpose, and click. Want to try a different chart type? Just click again and select a new chart type from a huge range of possibilities. Then work with the new Chart Tools to customize the design, layout, and formatting of your chart. You can see how various options would look just by pointing at them.
Apple's iOS 26 and iPadOS 26 updates are packed with new features, and you can try them before almost everyone else. First, check Gadget Hacks' list of supported iPhone and iPad models, then follow the step-by-step guide to install the iOS/iPadOS 26 beta — no paid developer account required.


Comments
Be the first, drop a comment!