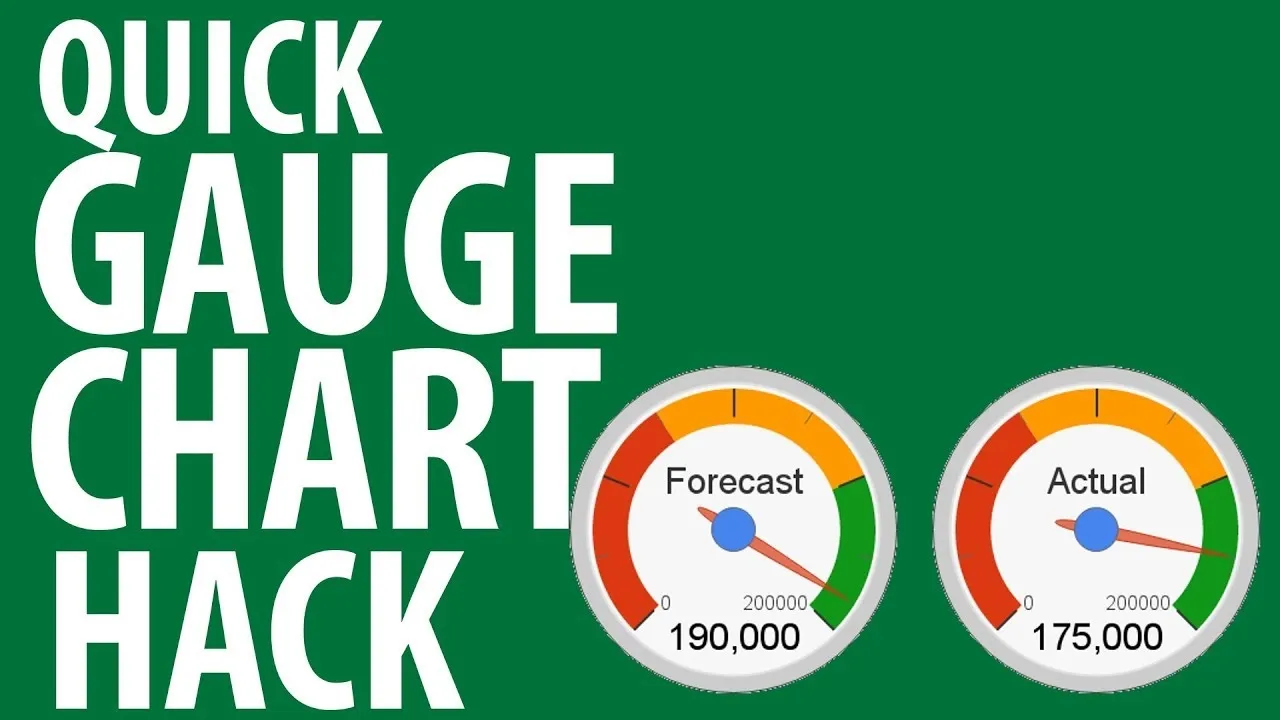
This screencast from Matthew MacDonald, author of Excel 2007: The Missing Manual, guides you through creating and modifying a combination chart in Excel 2007.
Apple's iOS 26 and iPadOS 26 updates are packed with new features, and you can try them before almost everyone else. First, check Gadget Hacks' list of supported iPhone and iPad models, then follow the step-by-step guide to install the iOS/iPadOS 26 beta — no paid developer account required.


Comments
Be the first, drop a comment!