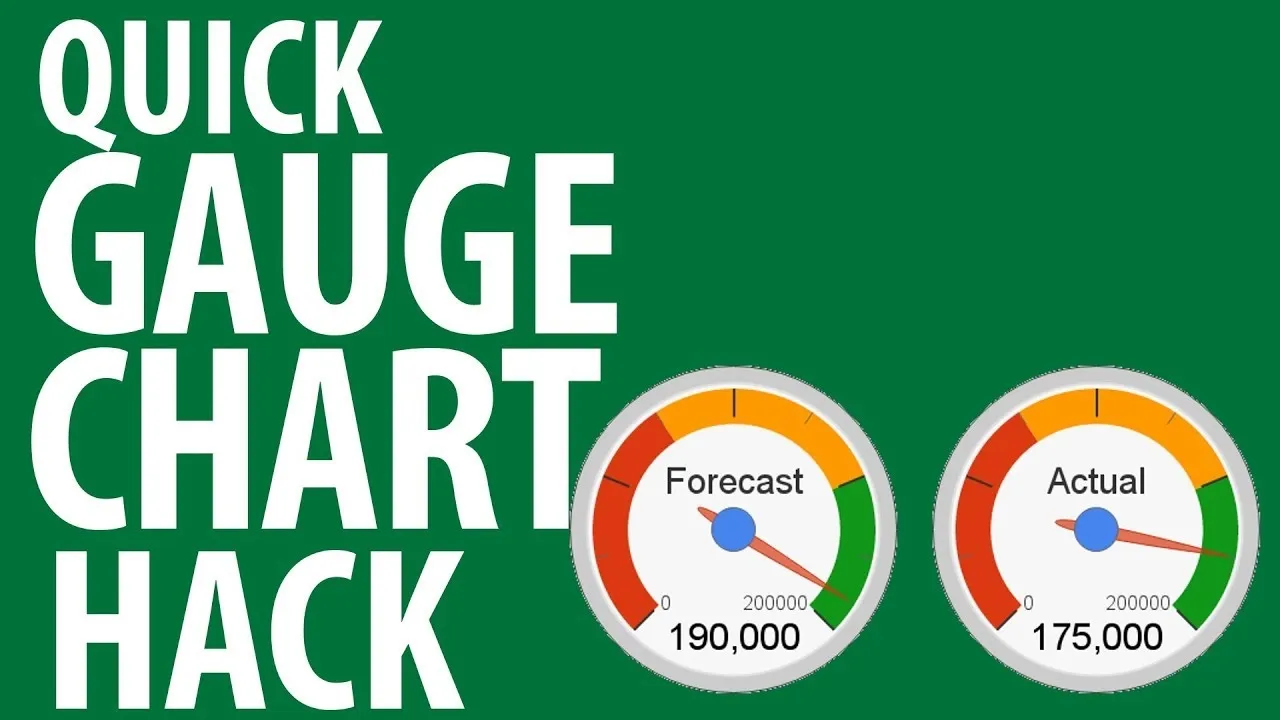
Want to generate a line chart in Excel 2011? This video will show you how it's done. Whether you're new to Microsoft's popular digital spreadsheet application, new to Excel 2011 or even an expert merely looking to brush up on the fundamentals, you're sure to be well served by this quality video tutorial from the folks at Lynda. For all of the details, and to get started creating and using line charts to visualize data in your own MS Excel '11 projects, watch the video.
Apple's iOS 26 and iPadOS 26 updates are packed with new features, and you can try them before almost everyone else. First, check Gadget Hacks' list of supported iPhone and iPad models, then follow the step-by-step guide to install the iOS/iPadOS 26 beta — no paid developer account required.


Comments
Be the first, drop a comment!