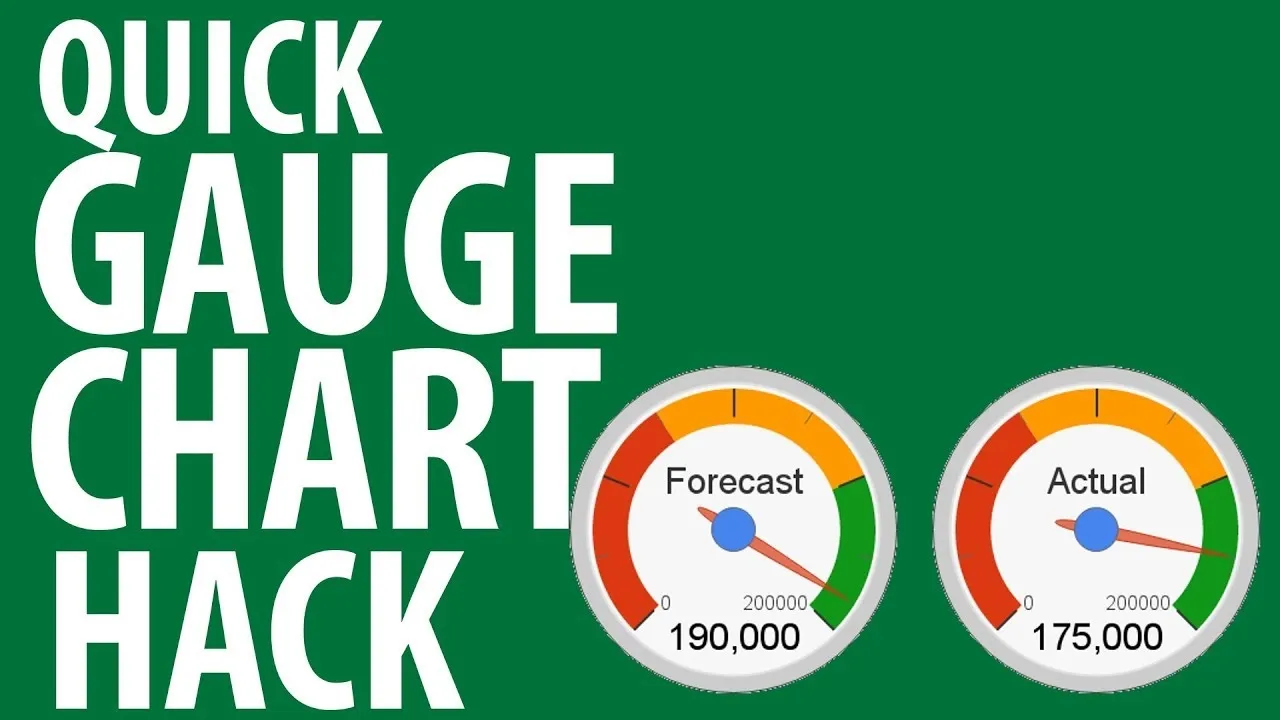
In this clip, you'll learn how to visual data with charts and graphs in MS Project 2010. Whether you're new to Microsoft's popular project management application or are just looking to better acquaint yourself with the Project 2010 workflow, you're sure to benefit from this free video software tutorial from Lynda. For more information, including detailed, step-by-step instructions, take a look.
Apple's iOS 26 and iPadOS 26 updates are packed with new features, and you can try them before almost everyone else. First, check Gadget Hacks' list of supported iPhone and iPad models, then follow the step-by-step guide to install the iOS/iPadOS 26 beta — no paid developer account required.


Comments
Be the first, drop a comment!