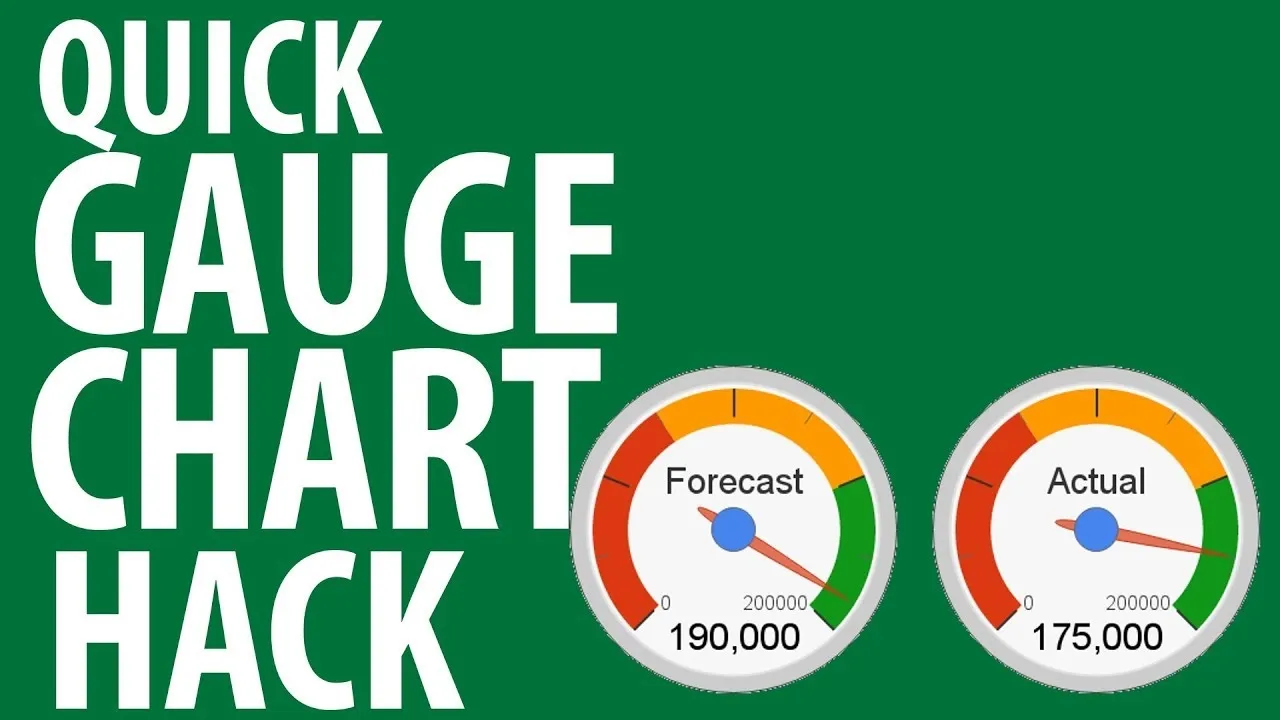
One of Microsoft Excel's capabilities is to allow you to graph Normal Distribution, or the probability density function, for your busines. This is a quick and easy tracking feature you can learn in just a few minutes.
Apple's iOS 26 and iPadOS 26 updates are packed with new features, and you can try them before almost everyone else. First, check Gadget Hacks' list of supported iPhone and iPad models, then follow the step-by-step guide to install the iOS/iPadOS 26 beta — no paid developer account required.


Comments
Be the first, drop a comment!