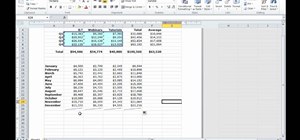
There is a new function in MS Excel 2010 called 'Sparkline' which helps you quickly find trends associated with a set of data. To create Sparkline, you can go to 'Insert' tab and then select 'Sparkline' section and then select the graph type. After you enter the data range and location range, the Sparkline will show up indicating the trend based on the data range you identified earlier. You can change the types and styles of your Sparkline easily. As the video demonstrates, whenever you use Excel 2010 and need a visual representation of trend alongside your data, the Sparkline function would be quite handy.
Just updated your iPhone? You'll find new emoji, enhanced security, podcast transcripts, Apple Cash virtual numbers, and other useful features. There are even new additions hidden within Safari. Find out what's new and changed on your iPhone with the iOS 17.4 update.










Be the First to Comment
Share Your Thoughts