

Microsoft Office Features


How To: Format whole & decimal numbers in Microsoft Excel
As you might guess, one of the domains in which Microsoft Excel really excels is business math. Brush up on the stuff for your next or current job with this how-to. In this tutorial from everyone's favorite digital spreadsheet guru, YouTube's ExcelIsFun, the 8th installment in his "Excel Business Math" series of free video lessons, you'll learn how to work with whole and decimal numbers. See how to write words to represent numbers (for checks). See how formatting can hide decimals.

How To: Create a data validation drop-down list from a table with duplicates in Excel
New to Microsoft Excel? Looking for a tip? How about a tip so mind-blowingly useful as to qualify as a magic trick? You're in luck. In this MS Excel tutorial from ExcelIsFun, the 608th installment in their series of digital spreadsheet magic tricks, you'll learn how to to create an expanding data validation drop-down list from table with duplicates using a number of different tricks.
How To: Share slides in iPhoto albums in PowerPoint: Mac 2008
Not everybody in this digital age has PowerPoint, whether on Windows or a Mac. But at least Mac users can find other ways to share their PowerPoint presentations with other Mac users via iPhoto. PowerPoint 2008 for Mac makes it easy to share your slideshows. The Microsoft Office for Mac team shows you just how to share PowerPoint slides as an iPhoto album in this how-to video.
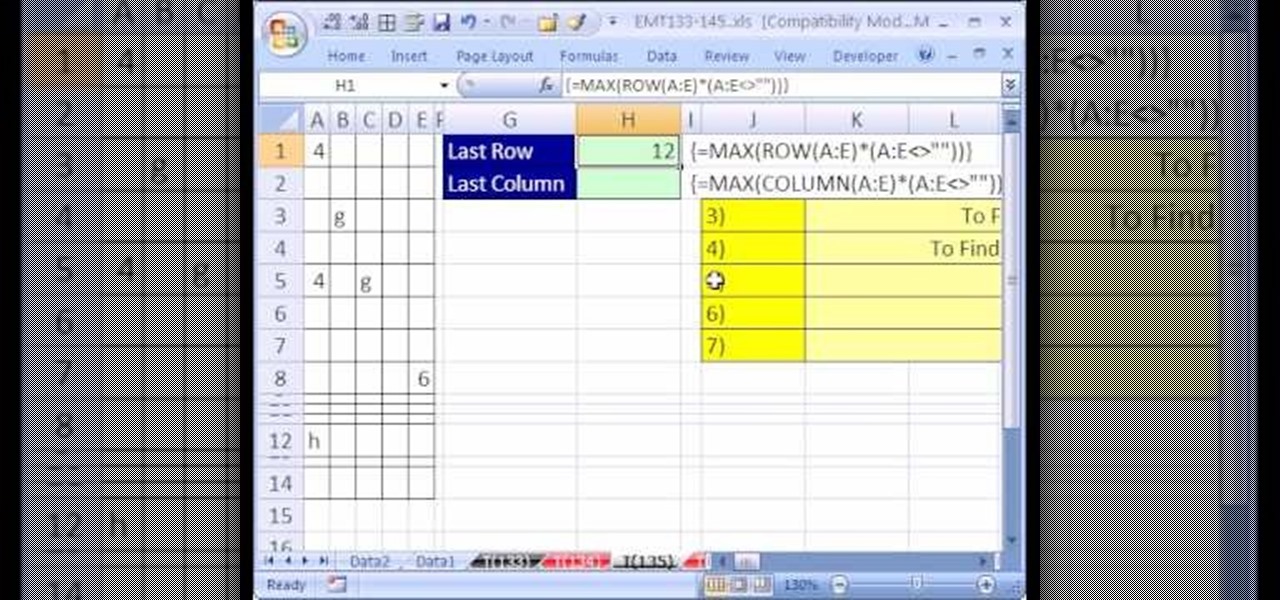
How To: Find the last row or column used in an Excel data set
New to Microsoft Excel? Looking for a tip? How about a tip so mind-blowingly useful as to qualify as a magic trick? You're in luck. In this MS Excel tutorial from ExcelIsFun, the 135th installment in their series of digital spreadsheet magic tricks, you'll learn how to create a dynamic range when there are blanks in the data set. Learn also how to use an array formula to find the Last row or column used in a data set.
How To: Use Excel names with pivot tables & data validation
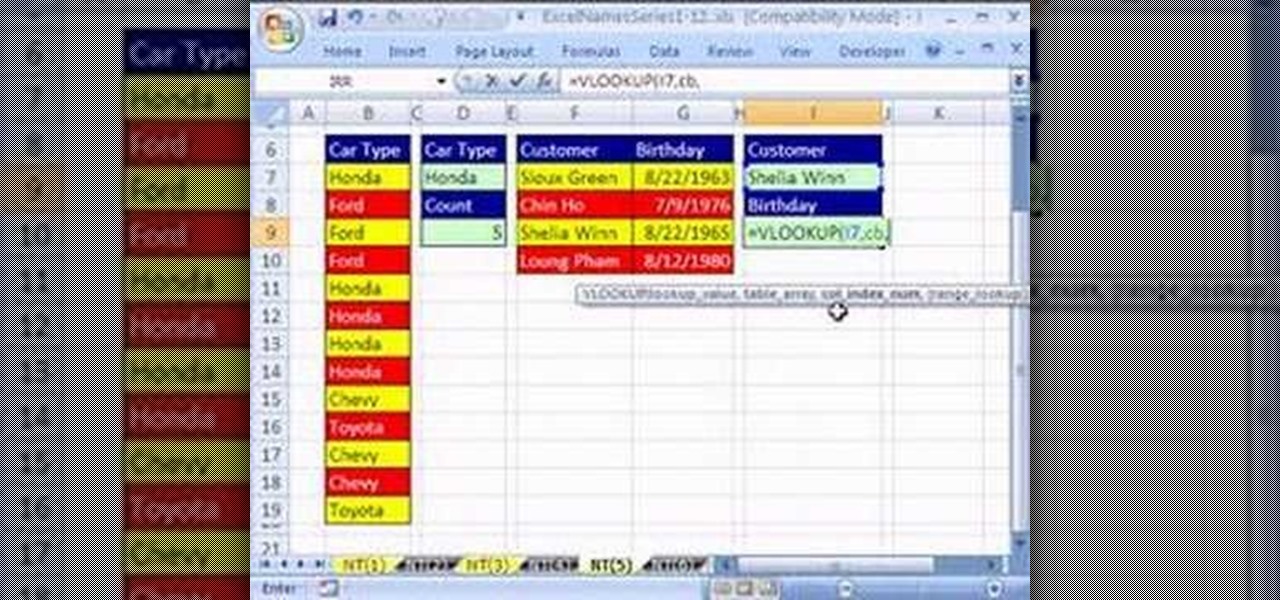
Looking for a primer on how to create and work with names in Microsoft Office Excel? You've come to the right place. In this free video tutorial from everyone's favorite MS Excel guru, YouTube's ExcelIsFun, the 5th installment in his series of Excel name tricks, you'll learn to use names with pivot tables, data validation & the VLOOKUP & COUNTIF functions and formulas.

How To: Print out a copy of your calendar in Microsoft Outlook for Mac 2011
Want to print out your Outlook 2011 calendar? This video will show you how it's done. Whether you're new to Microsoft's popular word processing application, new to MS Outlook 2011 or even an expert merely looking to brush up on the fundamentals, you're sure to be well served by this quality video tutorial from the folks at Lynda. For detailed, step-by-step instructions, watch the video.
How To: Create simple queries in Microsoft Office Access 2007
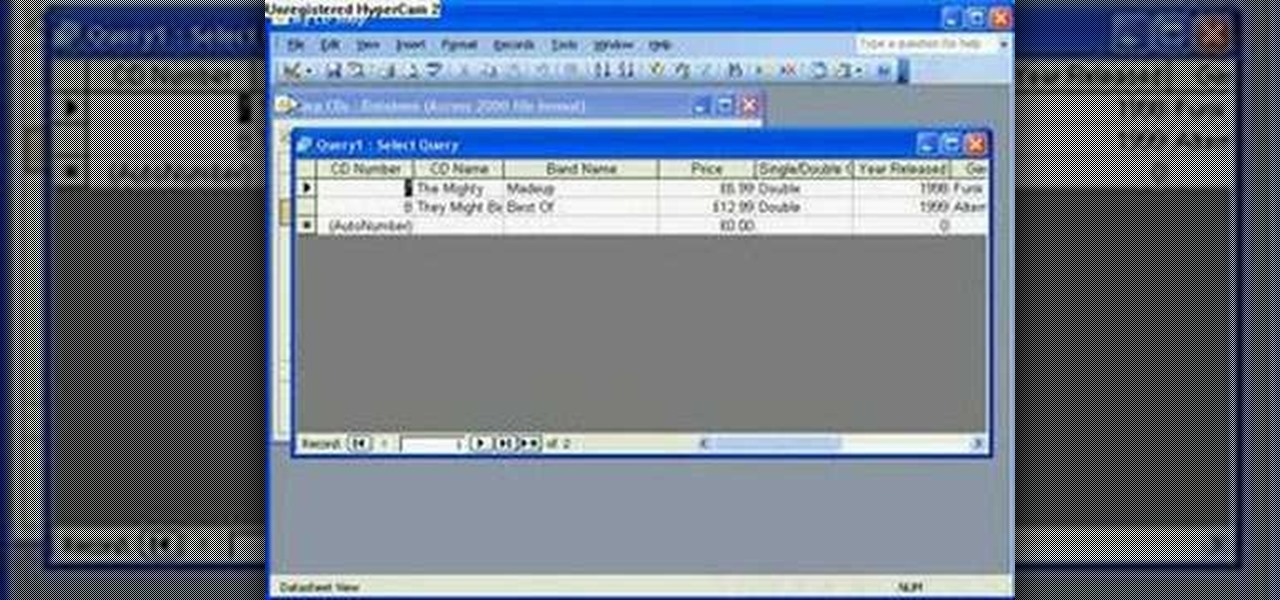
The Microsoft Office Access 2007 relational database manager enables information workers to quickly track and report information with ease thanks to its interactive design capabilities that do not require deep database knowledge. In this Microsoft Access video tutorial, you'll learn about using simple select queries on one or more fields. For more information, or to get started using simple queries in your own Microsoft Access databases, watch this how-to.
How To: Add scatter & bar data series to an Excel chart
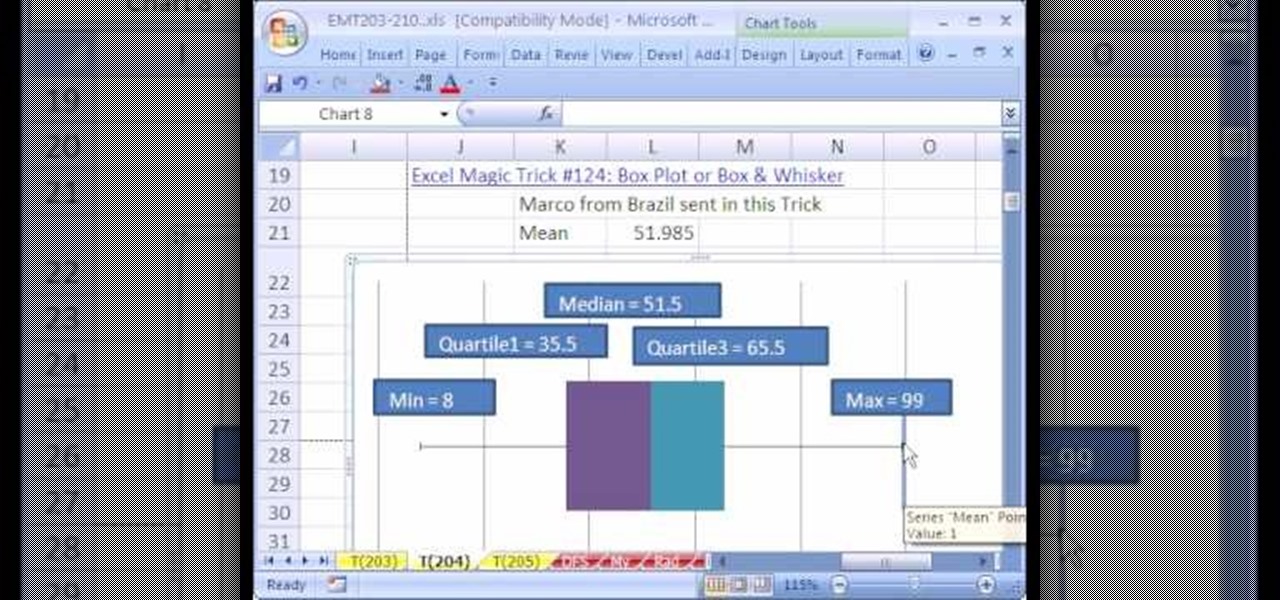
New to Microsoft Excel? Looking for a tip? How about a tip so mind-blowingly useful as to qualify as a magic trick? You're in luck. In this MS Excel tutorial from ExcelIsFun, the 204th installment in their series of digital spreadsheet magic tricks, you'll learn how to add a mean value as a scatter diagram data series to a box plot or box & whisker that is set up as a bar chart.
How To: Add a column of numbers while ignoring #N/A errors in Excel
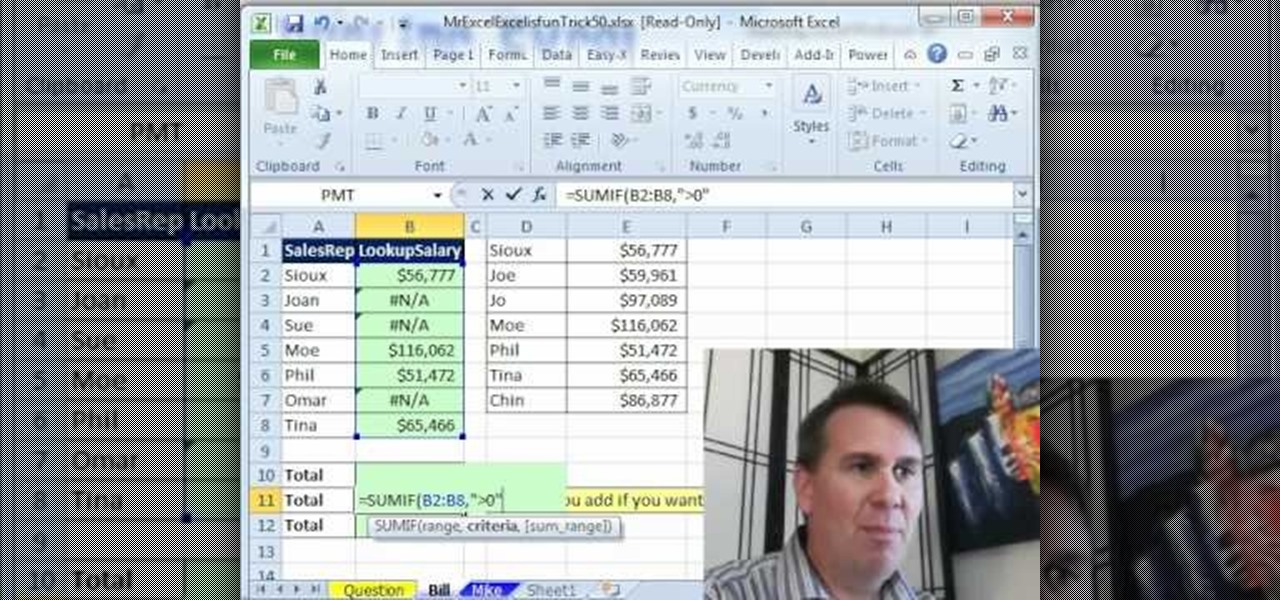
New to Microsoft Excel? Looking for a tip? How about a tip so mind-blowingly useful as to qualify as a magic trick? You're in luck. In this MS Excel tutorial from ExcelIsFun and Mr. Excel, the 52nd installment in their joint series of digital spreadsheet magic tricks, you'll learn how to add a column of numbers ignoring #N/A errors.
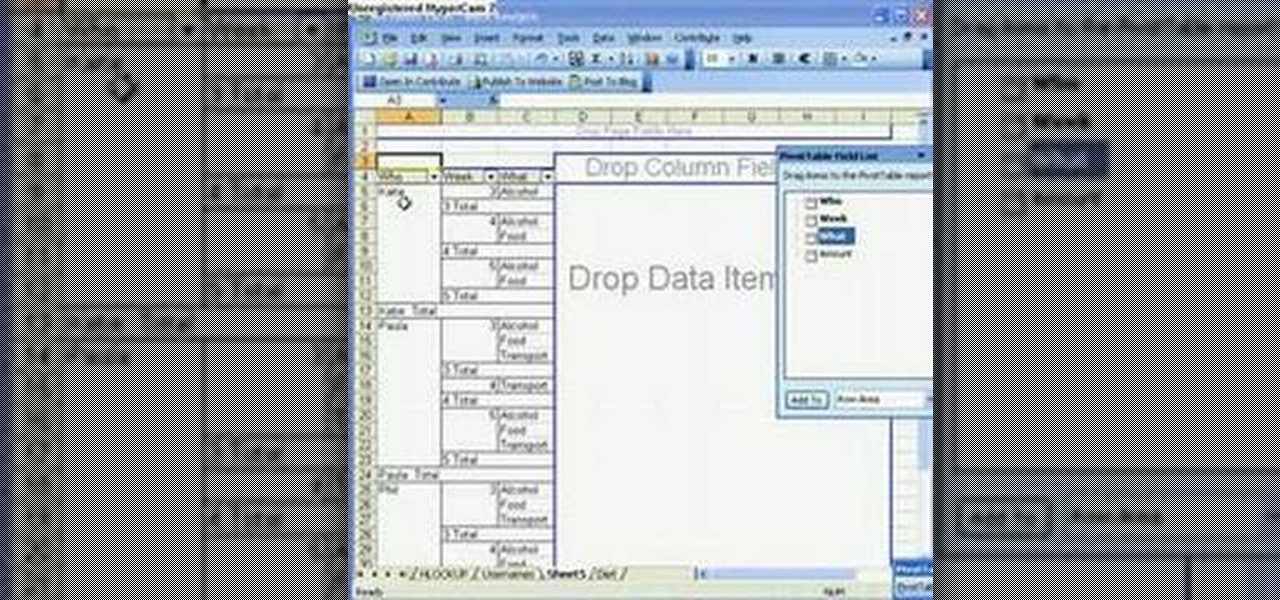
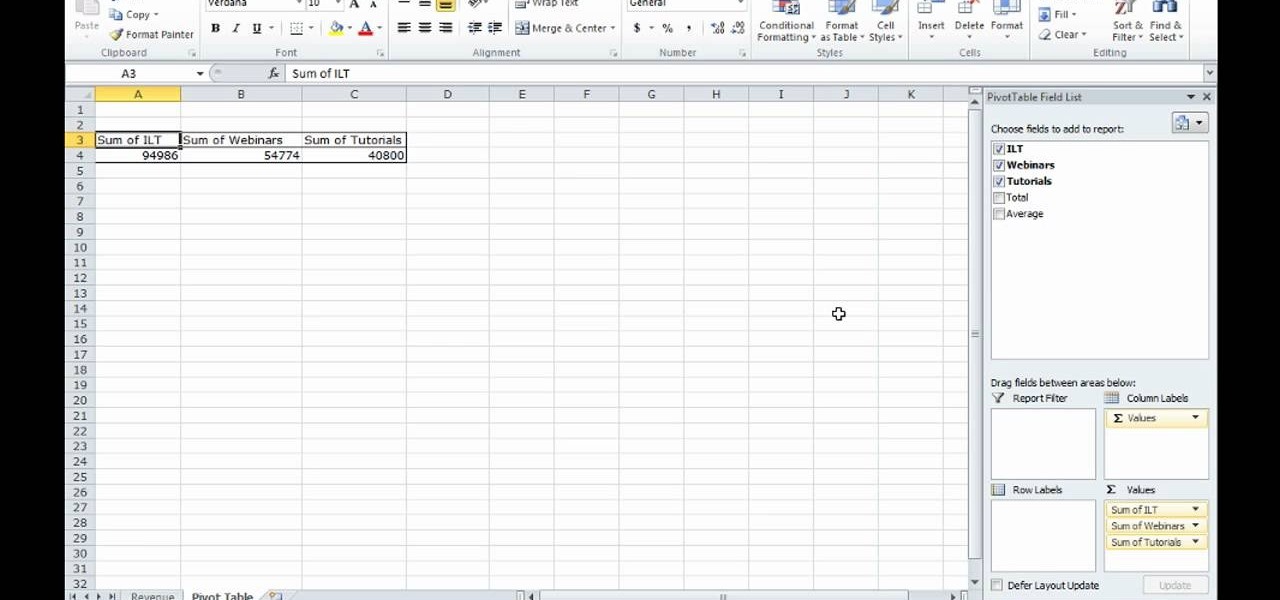
How To: Summarize data with pivot tables in Microsoft Excel
Microsoft Office Excel 2007 spreadsheet manager is a powerful tool that enables information workers to format spreadsheets, as well as analyze and share information to make more informed decisions. In this MS Excel video tutorial, you'll learn about using a pivot table to summarize data.
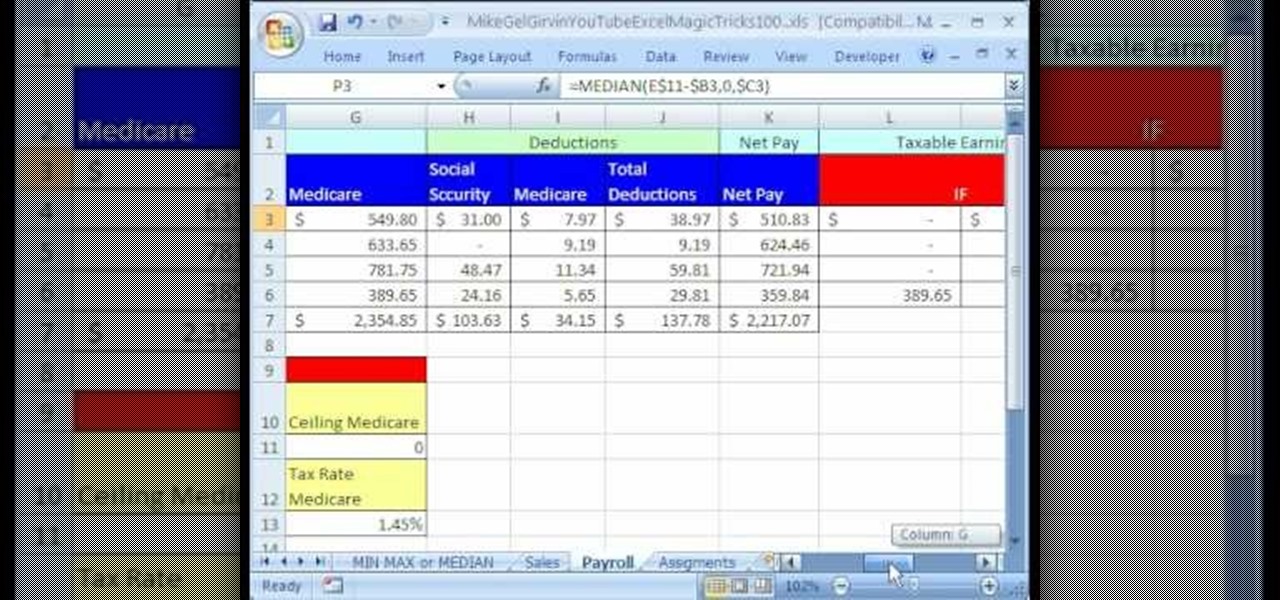
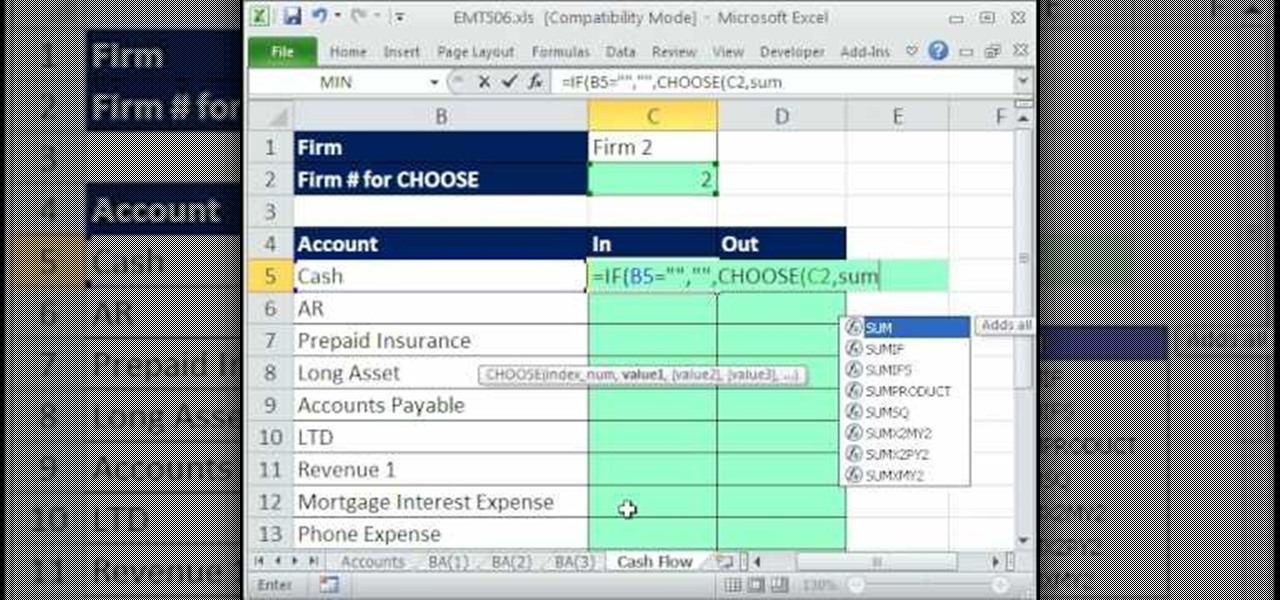
How To: Replace a long IF with a MIN/MAX formula in Excel
New to Excel? Looking for a tip? How about a tip so mind-blowingly advanced as to qualify as a magic trick? You're in luck. In this Excel tutorial from ExcelIsFun, the 100th installment in their series of digital spreadsheet magic tricks, you'll learn how to replace a long IF formula with a simple MIN/MAX formula (or an even simpler MEDIAN function). See 3 amazing examples. When you have a hurdle such a Commission Hurdle or a Payroll Taxable Earning Hurdle, and you are using an IF function fo...
How To: Use precision number rounding in Microsoft Excel
New to Excel? Looking for a tip? How about a tip so mind-blowingly useful as to qualify as a magic trick? You're in luck. In this Excel tutorial from ExcelIsFun, the 237th installment in their series of digital spreadsheet magic tricks, you'll learn how to

How To: Sync your Google and Outlook calendars
Google has released a sync tool which provides an automated 2 way sync between your Google and your Outlook 2003 or 2007 calendar. It was easy to install and set up, plus it works! Just log into your Google calendar and you'll see it at the top.
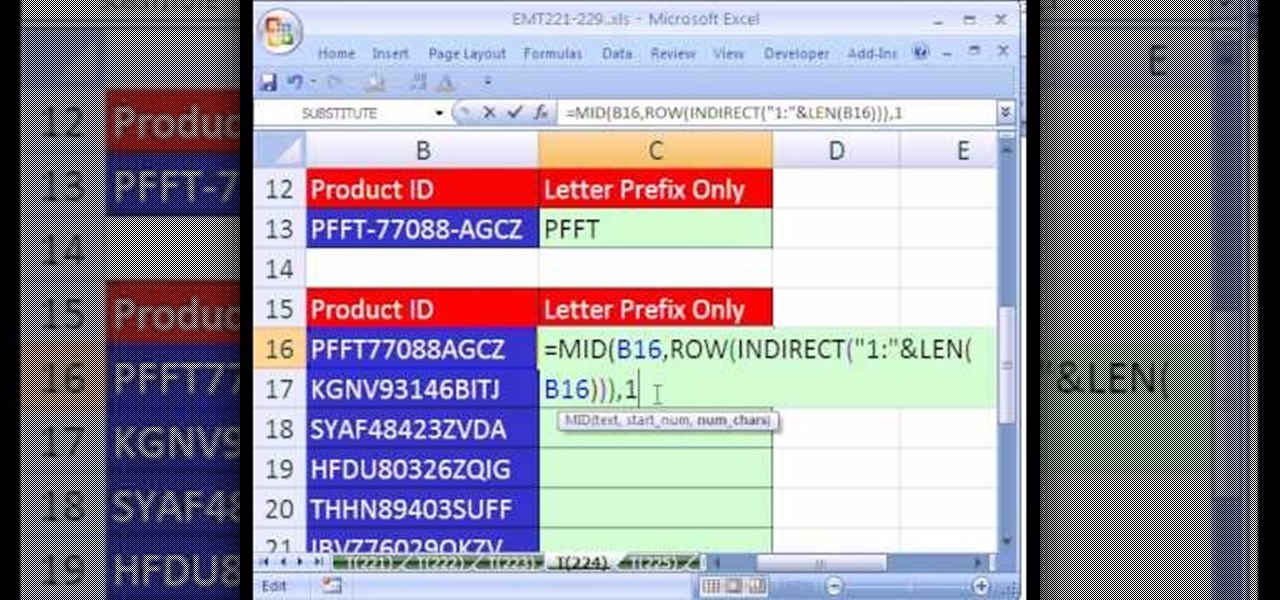
How To: Extract a prefix from a product ID in Microsoft Excel
New to Microsoft Excel? Looking for a tip? How about a tip so mind-blowingly useful as to qualify as a magic trick? You're in luck. In this MS Excel tutorial from ExcelIsFun, the 224th installment in their series of digital spreadsheet magic tricks, you'll learn how to extract a prefix from product ID when there is no dash or space to establish a pattern.

How To: Use Table Styles in Microsoft PowerPoint: Mac 2008
Sure, you can make boring tables inside PowerPoint 2008 for Mac, but who wants to add that dull element to their slideshow presentations? Nobody! Tables can be more than just numbers, they can be eye-catching and visually striking. The Microsoft Office for Mac team shows you just how to create great-looking tables by using Tables Styles in this how-to video.
How To: Filter data using MS Excel 2010's PivotTable slicer
This video shows how to make a quick pivot table data filtering by using Excel 2010's ‘Slicer’ functionality. ‘Slicer’ delivers enhanced visual filtering method to allow you to get the data you need more quickly. When selecting a cell in the pivot table you will find ‘Slicer’ in the filter group of the ‘Insert’ tab. Click on ‘Slicer’ and an 'Insert Slicer' dialogue shows up where you can pick particular data fields from the slider list. Once you click on ‘OK’, the ‘Slicer’ objects with filter...
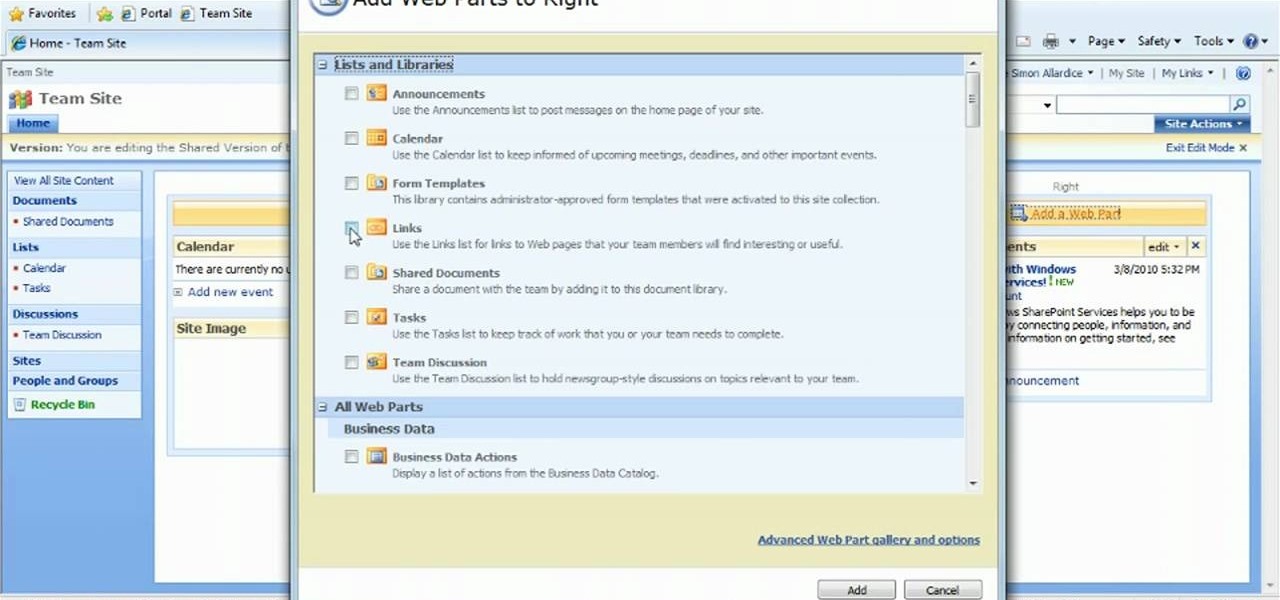
How To: Customize Web Parts in SharePoint Designer 2007
Learn how to customize Web Parts when working in Microsoft SharePoint 2007. Whether you're new to Microsoft's popular content management system (CMS) or a seasoned MS Office professional just looking to better acquaint yourself with the SharePoint 2007 workflow, you're sure to be well served by this video tutorial. For more information, and to get started using customized Web Parts in your own SharePoint projects, watch this free video guide.
How To: Use the Office clipboard in MS Word 2007
This video shows you how easy and convenient it is to use the Office clipboard in MS Word 2007. Go to the "Home" tab. Then click on the little

How To: Use the inverse hyperbolic sine function in Excel
This video demonstrates how to use the Excel function ASINH. This program determines the inverse hyperbolic sine of a number within a spreadsheet program.
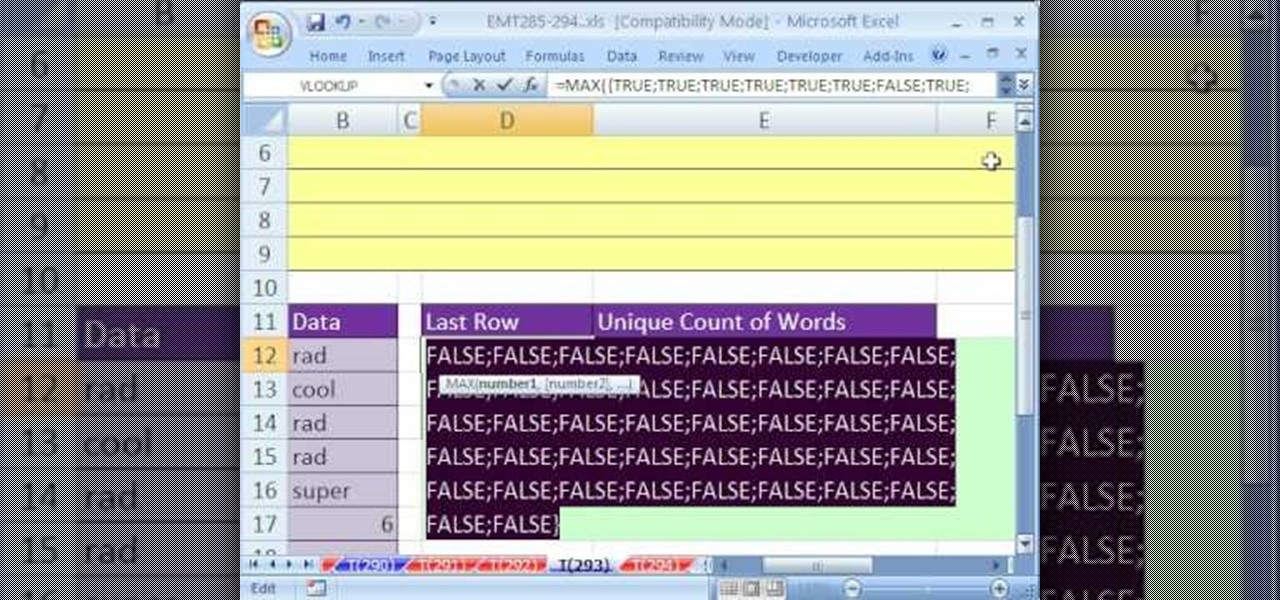
How To: Dynamically count unique words in a column in MS Excel
New to Excel? Looking for a tip? How about a tip so mind-blowingly useful as to qualify as a magic trick? You're in luck. In this Excel tutorial from ExcelIsFun, the 293rd installment in their series of digital spreadsheet magic tricks, you'll learn two cell formulas and a named formula that will dynamically count unique words in a column. As you add new records, the count will automatically update. This is accomplished through use of Excel's MAX, ROW, OFFSET, SUMPRODUCT, ISTEXT and COUNTIF f...

How To: Create data in a chart to graph in MS Word 2007
In this video the instructor shows how to create charts and graphs in Microsoft Word. First, open the Word document and select an area to insert the charts. Now go to the Insert tab in the ribbon and select the Chart icon. The Insert Chart window opens up with various chart templates. There are various categories of charts like Line, Pie, Bar in the left hand side. In the right hand side you can see the sample charts available and you can select any of them that you want. Now it transfers you...

How To: Extract digits to the right of a decimal in MS Excel
New to Microsoft Excel? Looking for a tip? How about a tip so mind-blowingly useful as to qualify as a magic trick? You're in luck. In this MS Excel tutorial from ExcelIsFun, the 580th installment in their series of digital spreadsheet magic tricks, you'll learn how to use the REPLACE, MID, COLUMNS and SEARCH functions to extract numbers to the right of a decimal into their individual cells.
How To: Reformat a document with Quick Style Sets in Microsoft Word for Mac 2011
With Quick Style Sets, it's easy to quickly reformat a Word 2011 document. This video will show you how it's done. Whether you're new to Microsoft's popular word processing application, new to MS Word 2011 or even an expert merely looking to brush up on the fundamentals, you're sure to be well served by this quality video tutorial from the folks at Lynda. For all of the details, and to get started using Quick Style Sets in your own Office for Mac 2011 projects, watch the video.

How To: Use the Toolbox in Microsoft Office: Mac 2008
The Toolbox in Office 2008 for Mac is more than just a simple formatting palette. There's so much you can do, so much you accomplish, but you need to know how to take advantage of everything offered in the Office Toolbox, whether in PowerPoint, Entourage, Word, or Excel. The Microsoft Office for Mac team shows you just how to format, insert, research, and clip with the Toolbox in this how-to video. Check out all of the things it can do!
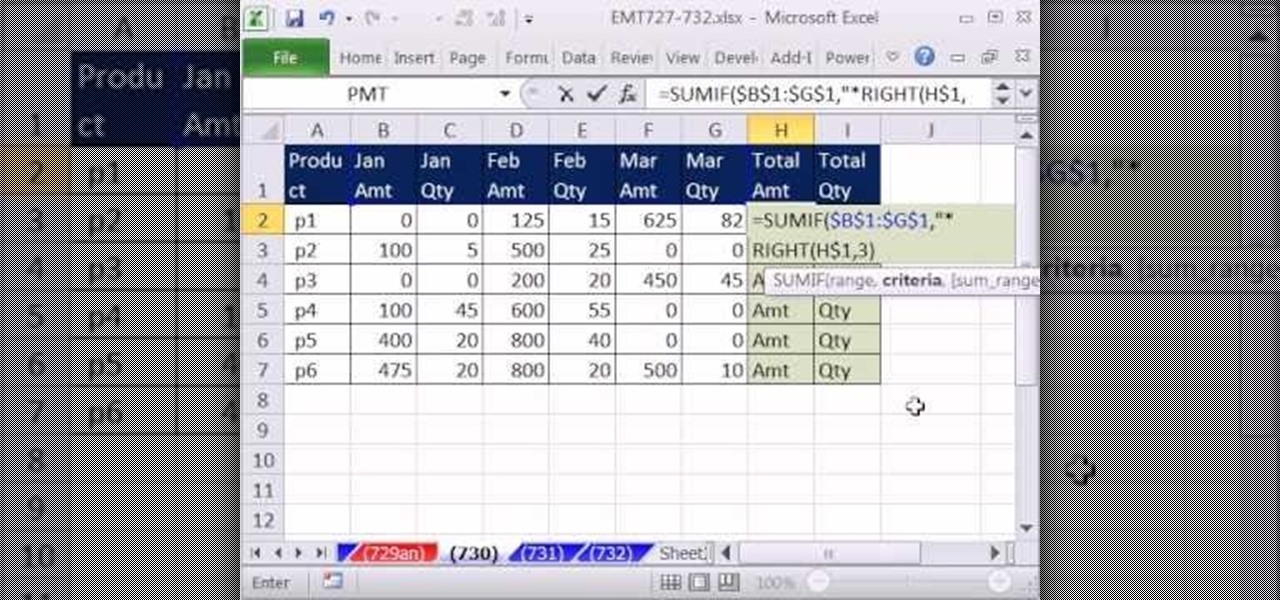
How To: Use the SUMIF function with approximate criteria in Microsoft Excel
New to Microsoft Excel? Looking for a tip? How about a tip so mind-blowingly useful as to qualify as a magic trick? You're in luck. In this MS Excel tutorial from ExcelIsFun, the 730th installment in their series of digital spreadsheet magic tricks, you'll learn how to use the SUMIF function with approximate criteria to add when criteria has other content in the cell.

How To: Combine contents of multiple cells into one on Excel
Take a look at this instructional video and learn how to combine the contents of multiple cells into one cell in Microsoft Excel 2007. This software offers two formulas to perform this combination.
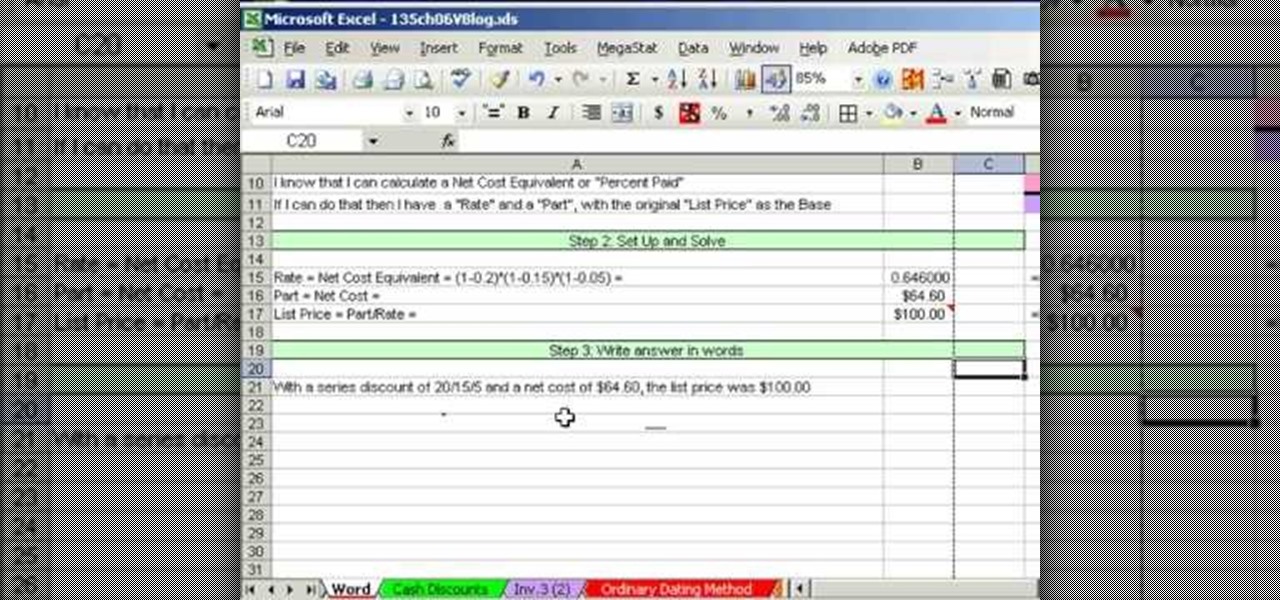
How To: Solve trade discount word problems in Microsoft Excel
As you might guess, one of the domains in which Microsoft Excel really excels is business math. Brush up on the stuff for your next or current job with this how-to. In this tutorial from everyone's favorite digital spreadsheet guru, YouTube's ExcelIsFun, the 45th installment in his "Business Math" series of free video lessons, you'll learn when to solve a trade discount word problem with Excel.

How To: Embed a video into PowerPoint on a Mac
One of the best ways to get your point across during a PowerPoint presentation is to use video. This way, you can not only tell your classmates, students or coworkers about your subject with words and images, but you can actually show them with real footage.
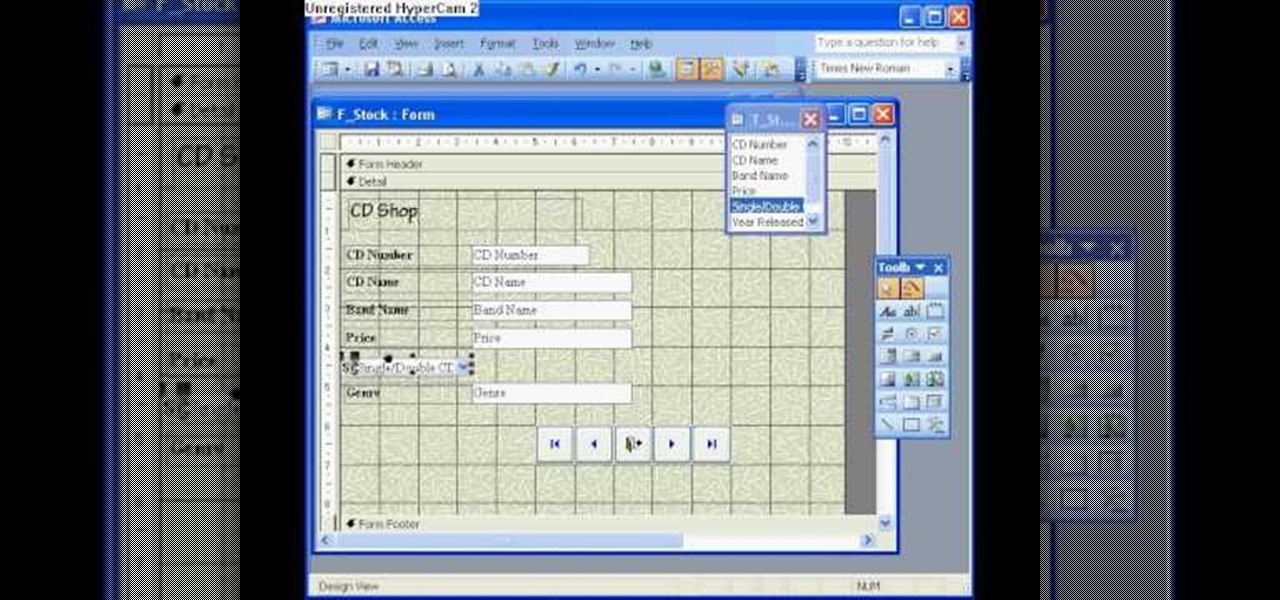
How To: Add fields, tables and forms in Microsoft Access
The Microsoft Office Access 2007 relational database manager enables information workers to quickly track and report information with ease thanks to its interactive design capabilities that do not require deep database knowledge. In this Microsoft Access video tutorial, you'll learn how to add and modifying fields to a pre-existing table, and applying these changes to an associated form. To get started adding and modifying fields, tables and forms in Access, take a look!
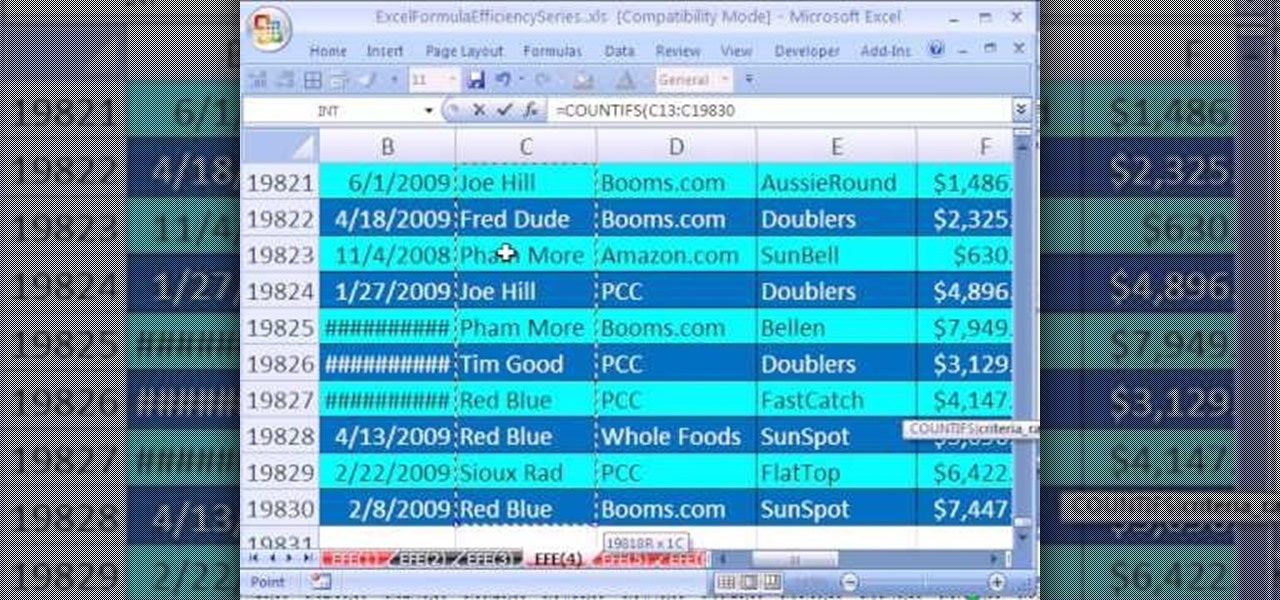
How To: Use SUMIFS and COUNTIFS in Microsoft Excel 2007
Are you looking for a way to make your Microsoft Excel formulas simpler, faster and more efficient? If so, you're in the right place. With this free video lesson from everyone's favorite digital spreadsheet guru, YouTube's ExcelsFun, the 7th installment in his "Excel Formula Efficiency" series, you'll learn about the SUMIFS function and how it blows SUMPRODUCT away when it comes to calculation speed.
How To: Return a row's first non-blank cell in Microsoft Excel
New to Microsoft Excel? Looking for a tip? How about a tip so mind-blowingly useful as to qualify as a magic trick? You're in luck. In this MS Excel tutorial from ExcelIsFun, the 364th installment in their series of digital spreadsheet magic tricks, you'll learn how to create an array formula using the INDEX, MATCH & NOT functions that will return cell content from the first non-blank cell in a row.
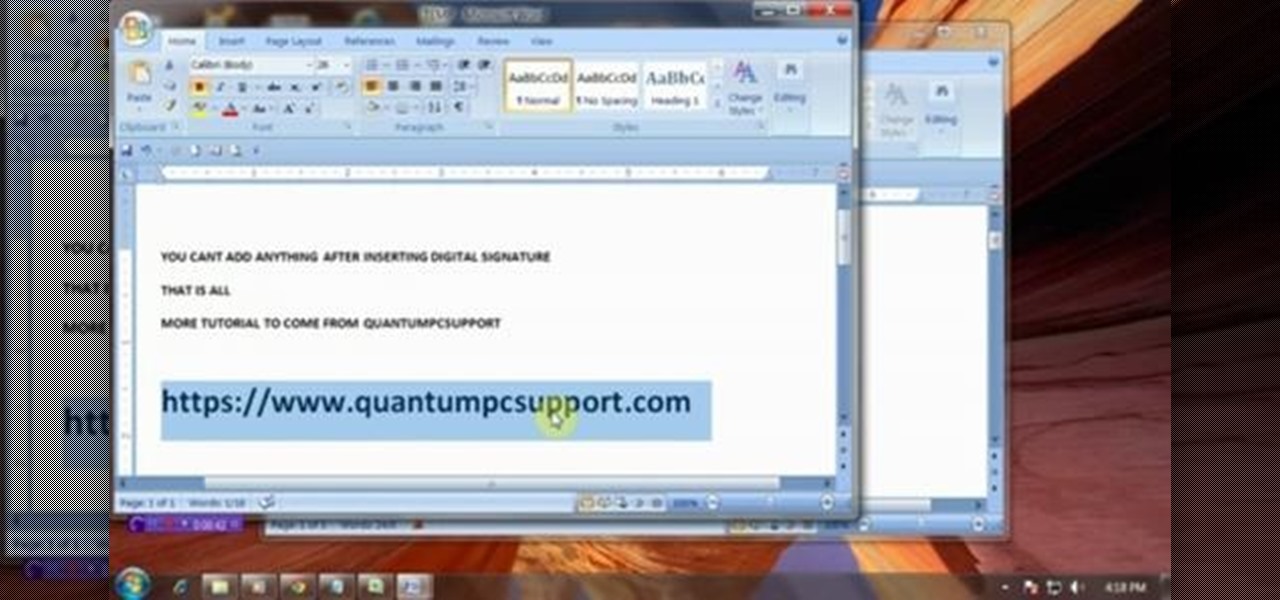
How To: Make Digital Signature in MS Word
This video will guide you how to make digital signature in MS Word. The digital signature will allow to secure your document from tampering. When you set digital signature in your word text then you can't insert anything in the document anymore. You could add your image of signature with text.

How To: Conditionally format a vertical histogram in Excel 07
New to Microsoft Excel? Looking for a tip? How about a tip so mind-blowingly useful as to qualify as a magic trick? You're in luck. In this MS Excel tutorial from ExcelIsFun, the 199th installment in their series of digital spreadsheet magic tricks, you'll learn how to apply conditional formatting to a vertical histogram based on a frequency distribution in Microsoft Excel 2007.
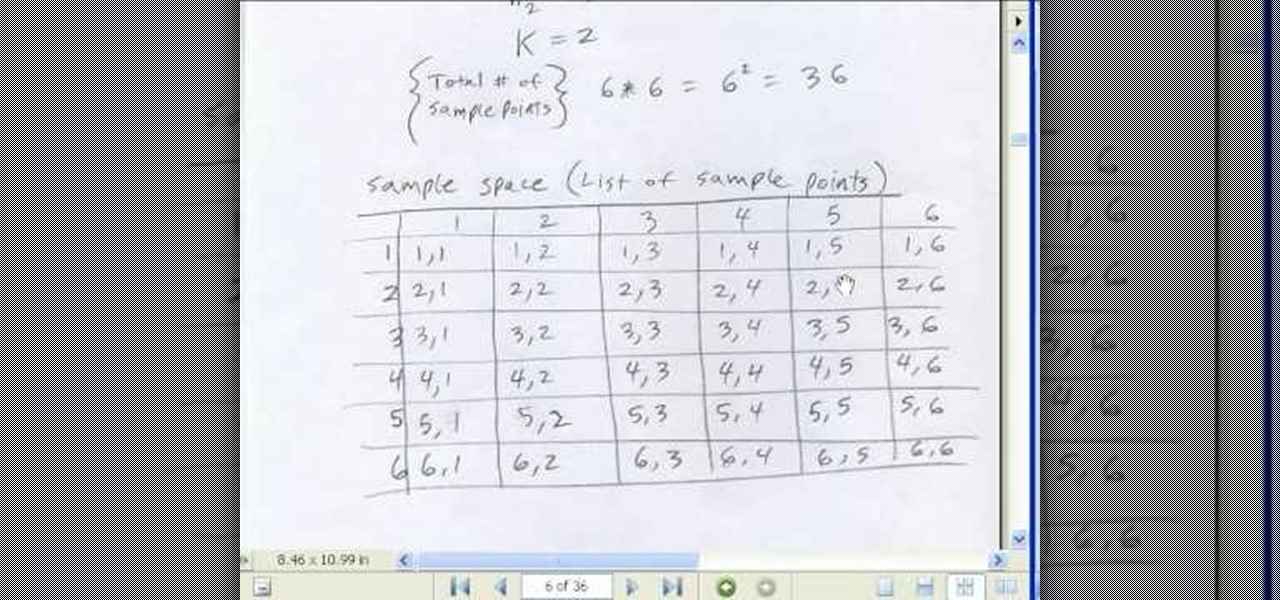
How To: Work with probabilities in Microsoft Office Excel
If you use Microsoft Excel on a regular basis, odds are you work with numbers. Put those numbers to work. Statistical analysis allows you to find patterns, trends and probabilities within your data. In this MS Excel tutorial from everyone's favorite Excel guru, YouTube's ExcelsFun, the 50th installment in his "Excel Statistics" series of free video lessons, you'll learn the basics of probability:
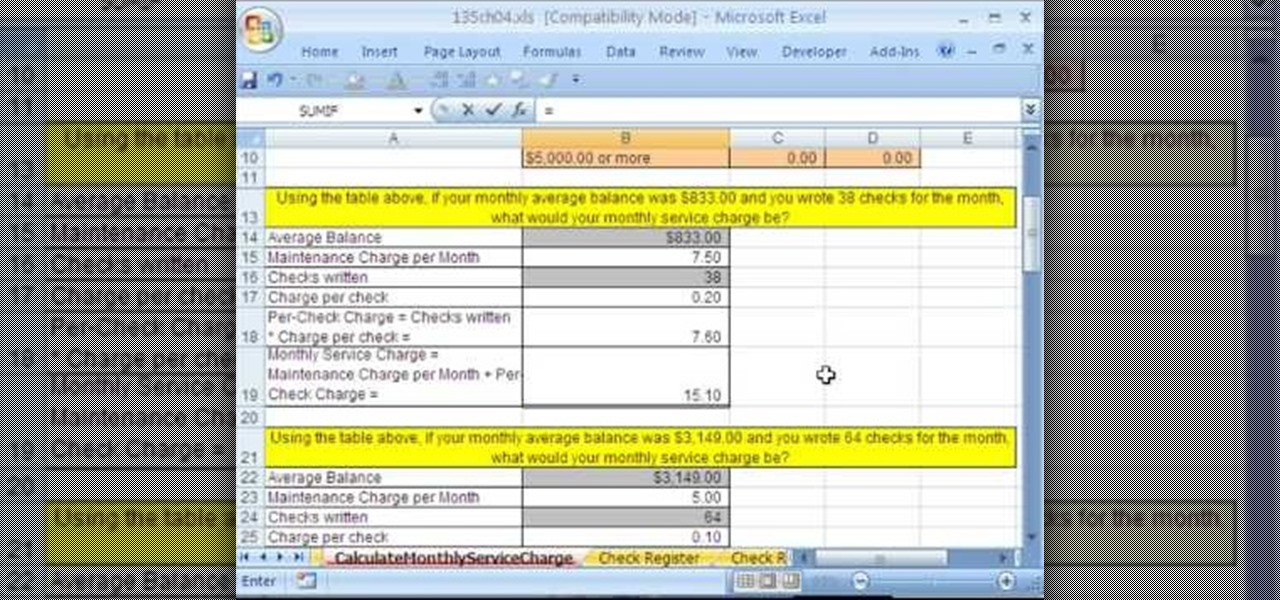
How To: Find a checking account's service charge MS Excel
As you might guess, one of the domains in which Microsoft Excel really excels is business math. Brush up on the stuff for your next or current job with this how-to. In this tutorial from everyone's favorite digital spreadsheet guru, YouTube's ExcelIsFun, the 35th installment in his "Excel Business Math" series of free video lessons, you'll learn how to calculate the service charge for a checking account and see how to create a formula for the balance in a checkbook or checking register.

How To: Insert and edit pictures in Word
Want to learn how to insert and manage images in Microsoft Word? See how to crop, rotate, and format photos in this program.

How To: Set a milestone in MS Project 2007
In this software video tutorial you will learn how to set a milestone in MS Project 2007. Milestone is an important task. Lot many times a milestone is like a goal or deadline to be completed by a particular date. It is defined as a task that doesn't have a duration. To make a milestone, enter a task and under duration, enter 0d. This will turn in to a milestone. To make task in to a milestone, double click on the task. On the next window that comes up, look for and click on the 'advanced' ta...
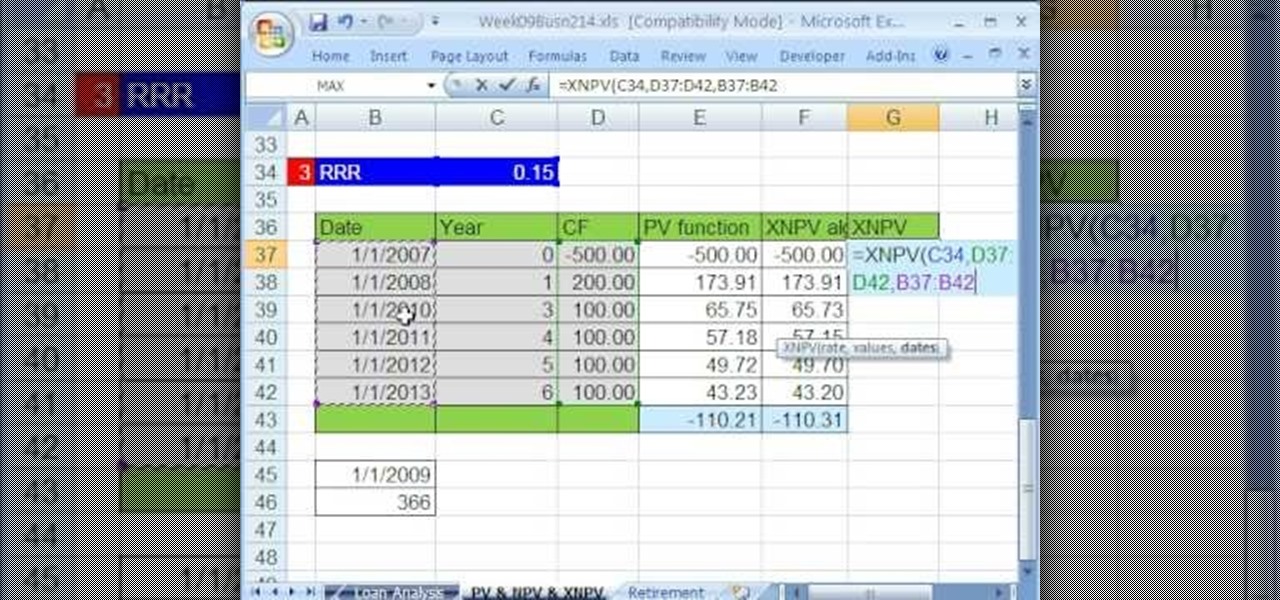
How To: Value assets & analyze cash flows in Microsoft Excel
Whether you're interested in learning Microsoft Excel from the bottom up or just looking to pick up a few tips and tricks, you're in the right place. In this tutorial from everyone's favorite digital spreadsheet guru, ExcelIsFun, the 50th installment in his "Highline Excel Class" series of free video Excel lessons, you'll learn how to value an asset as well as perform discounted cash flow analysis with the Excel functions PV, NPV & XNPV.
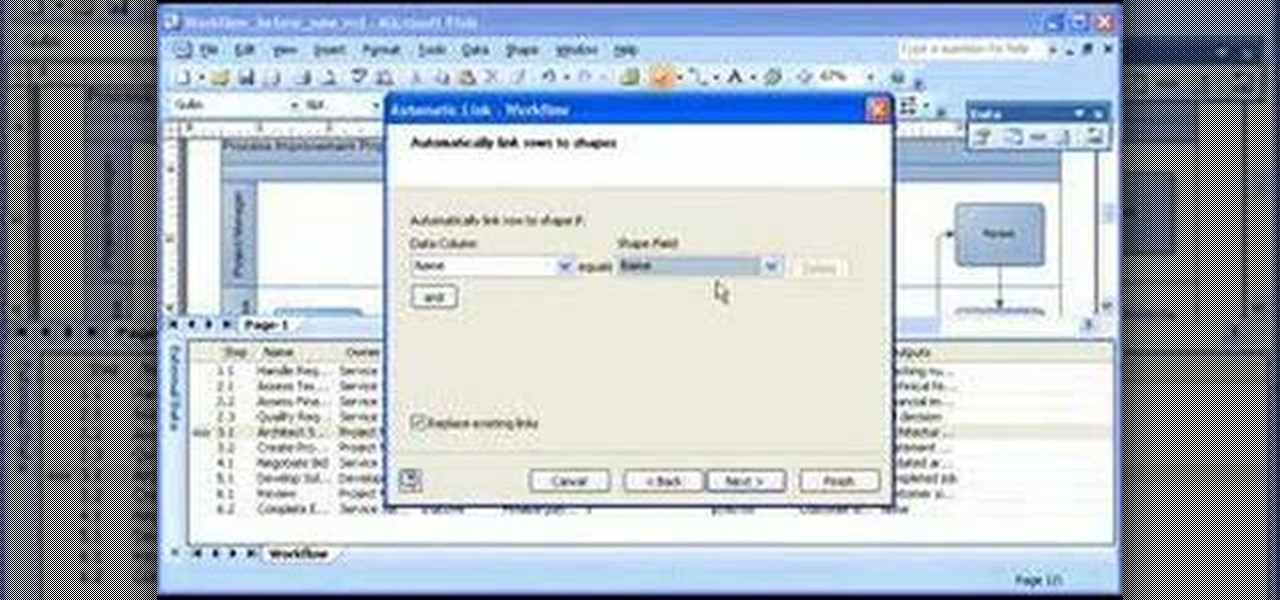
How To: Connect data to your Visio diagram
Take a look at this instructional video and learn how to analyze how a process or other area is actually performing by connecting data to the shapes in your diagram with Microsoft Visio 2007. You can also add different visual effects based on the data values. For example, you can link sales data from an Excel workbook to the shapes it relates to. When a phase of the sales process takes longer than guidelines recommend, the shape for that phase changes color or shows an icon that alerts you to...
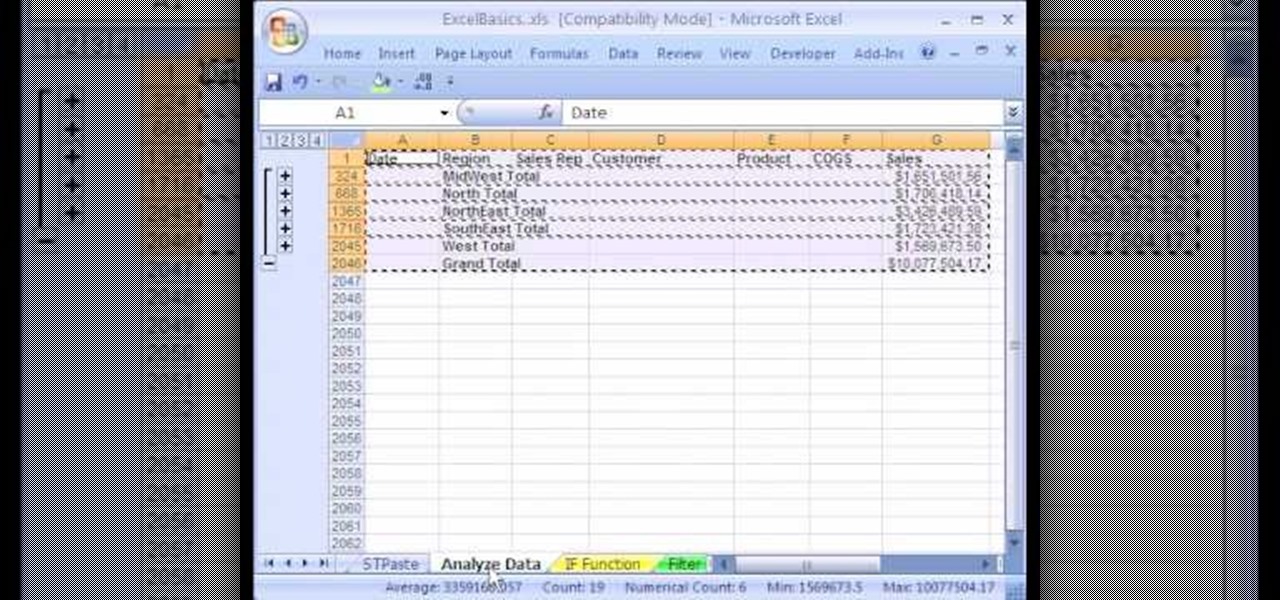
How To: Use Excel data analysis subtotals
1. The following instruction describes how to generate sub totals in Microsoft Excel Sheet. 2. Take Region as a Primary column and Sales Rep as a Secondary Column. 3. First method to sort: Select a cell in Region and goto Data select A to Z. 4. Second method to sort: Select a cell in Region and Right click and select Sort A to Z 5. Then click a cell in Region and select Data->OutLine->SubTotal 6. In the SubTotal Window select 1.Each Change in: Region 2.Use function:Sum 3.Add subTotal to:Sales...