

Microsoft Office Features

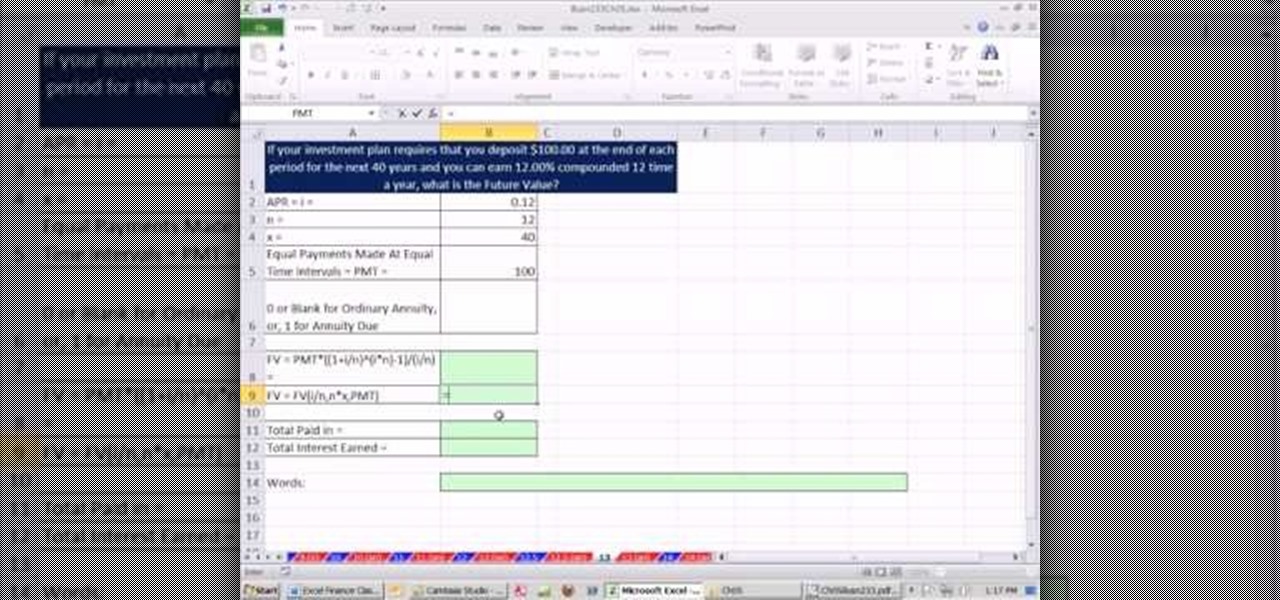
How To: Calculate the future value of annuity with the FV function in Excel
As you might guess, one of the domains in which Microsoft Excel really excels is finance math. Brush up on the stuff for your next or current job with this how-to. In this tutorial from everyone's favorite digital spreadsheet guru, YouTube's ExcelIsFun, part of his "Excel Finance Class" series of free video lessons, you'll learn how to use the FV function to calculate the future value of an annuity.
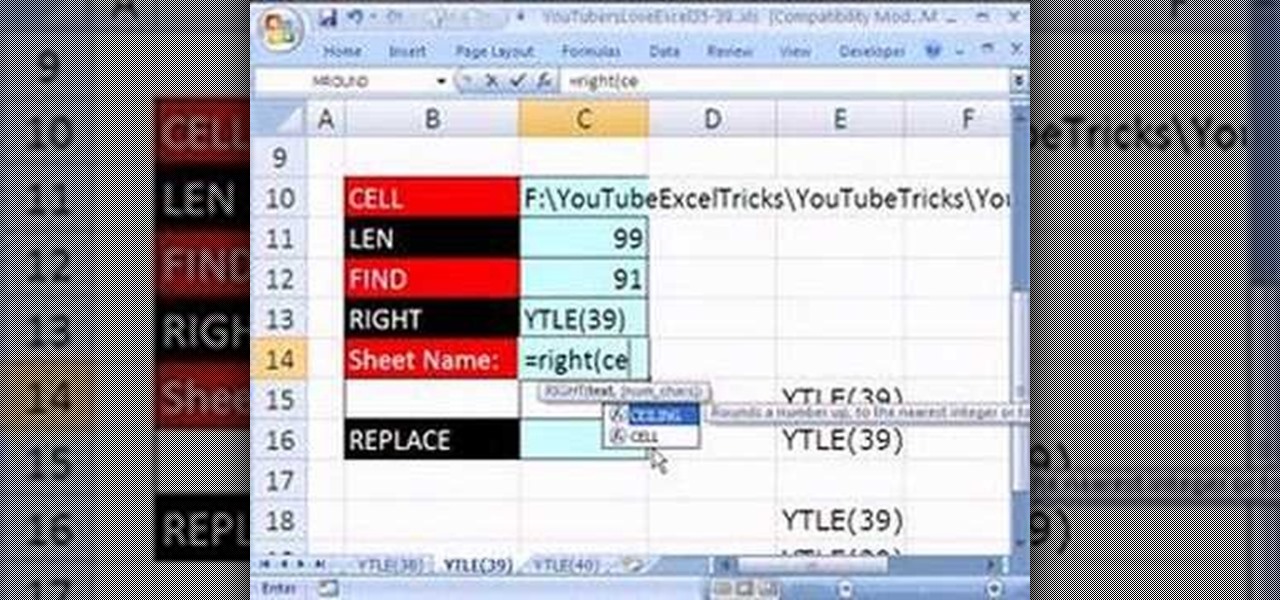
How To: Deliver the sheet tab name to a cell in MS Excel
Love Microsoft Excel? This clip contains a tip that just might induce you to. With this free video tutorial from ExcelIsFun, the 39th installment of his "YouTubers Love Excel" or YTLE series of free video MS Excel lessons, you'll learn how to use the RIGHT, LEN, FIND & REPLACE functions in a formula to deliver a sheet tab name to a cell!
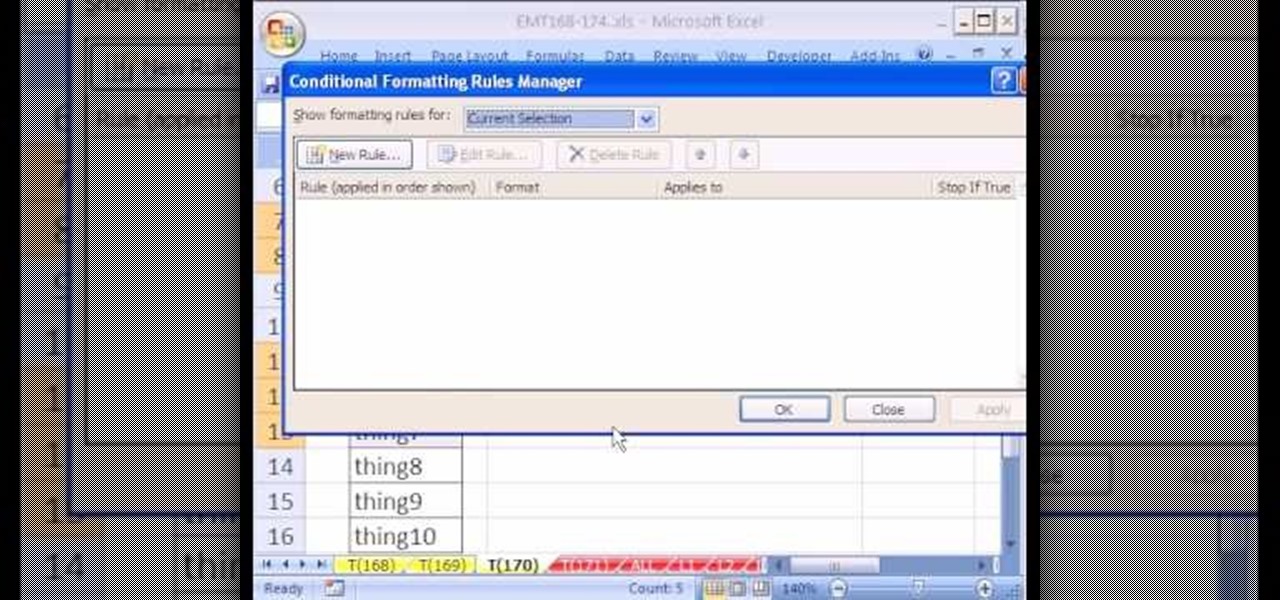
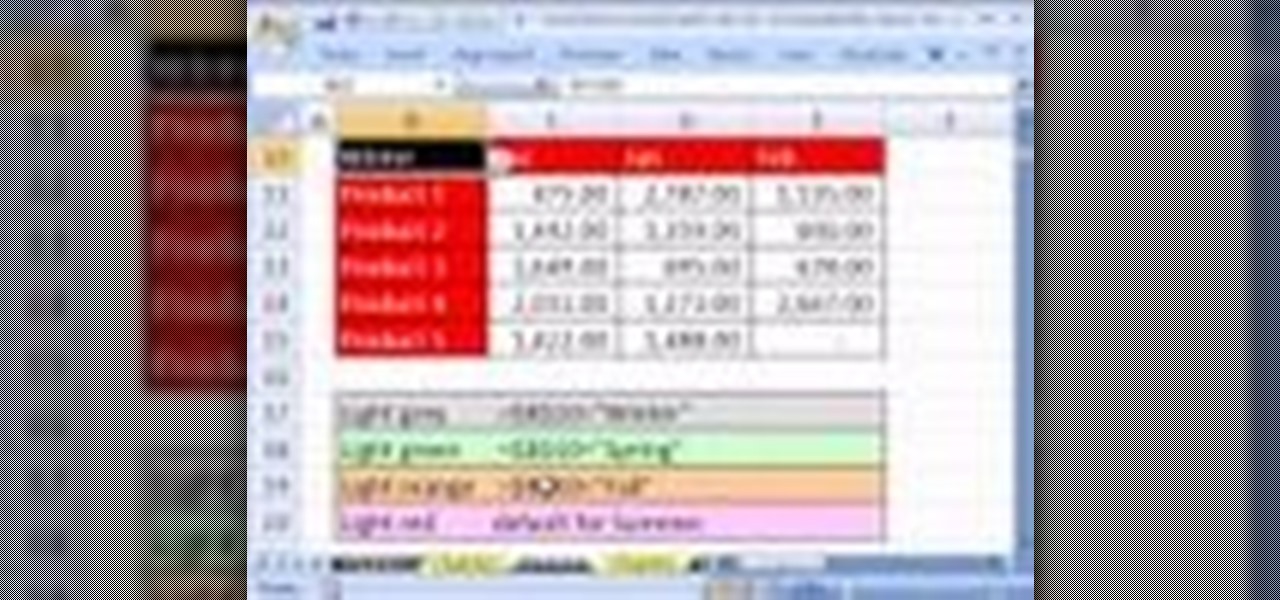
How To: Hide list items with conditional formatting in Excel
New to Microsoft Excel? Looking for a tip? How about a tip so mind-blowingly useful as to qualify as a magic trick? You're in luck. In this MS Excel tutorial from ExcelIsFun, the 170th installment in their series of digital spreadsheet magic tricks, you'll learn how to use conditional formatting to hide or show items in a list using a TRUE/FALSE formula.
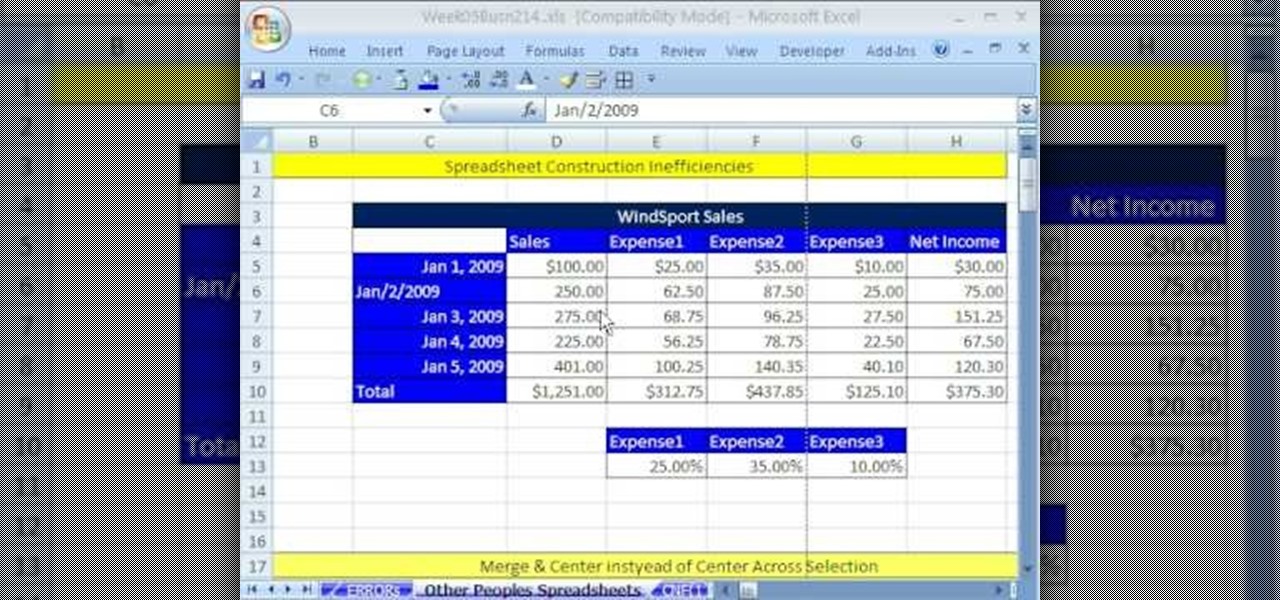
How To: Fix other people's Microsoft Excel spreadsheets
Whether you're interested in learning Microsoft Excel from the bottom up or just looking to pick up a few tips and tricks, you're in the right place. In this tutorial from everyone's favorite digital spreadsheet guru, ExcelIsFun, the 26th installment in his "Highline Excel Class" series of free video Excel lessons, you'll learn how to use spreadsheet construction guidelines to fix common problems:
How To: Use a calendar for future projects in MS Project 2007
In this tutorial, we learn how to use a calendar for future projects in MS Project 2007. First, go to the "tools" menu, then down to organizer. Choose the calendar tab and then change what the calendars are available in. Choose ABC Limited, then click on "copy". Now, click on "close" and open up a new project. From here, go to "project" then "project information", and you will be able to change to the other calendar. Remember to change the default under the options so you have the correct tim...
How To: Change an Excel table's conditional formatting with DV
Love Microsoft Excel? This clip contains a tip that just might induce you to. With this free video tutorial from ExcelIsFun, the 43rd installment of his "YouTubers Love Excel" or YTLE series of free video MS Excel lessons, you'll learn use a data validation drop-down list to change conditional formatting in a table. Learn to love digital spreadsheets more perfectly with the tricks outlined in this free Microsoft Office how-to.
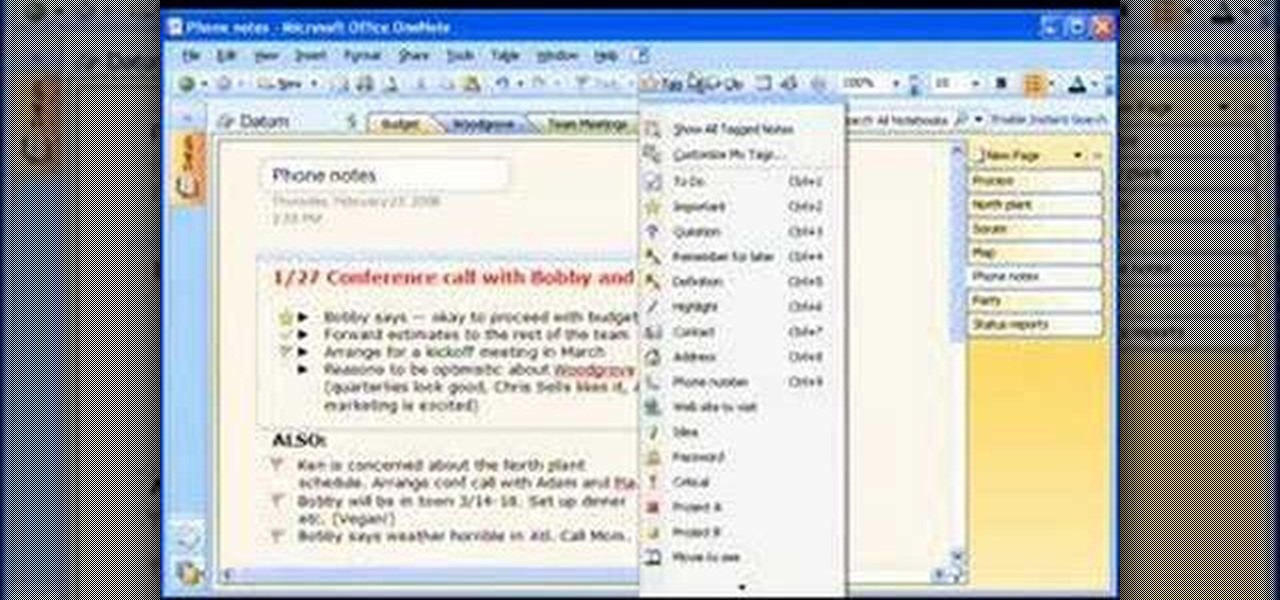
How To: Create space and move pages in OneNote
Take a look at this instructional video and learn how to create space in your note containers and move pages in Microsoft Office OneNote 2007. See how much control you have over how your notebook is set up, from a few words on a page to entire pages to whole sections. You'll also see the many ways you can find information in your notebook. Search for keywords, which OneNote will find no matter where they are — in text, in hand-written ink, in URLs, in graphics, even spoken in audio files. Or,...

How To: Build a document with building blocks in Word 2007
Fear the blank page no longer. With the new building blocks feature in Word 2007, you can create sharp-looking business documents more easily than ever. Take a look at this instructional video and learn how to assemble your document from galleries of predesigned parts, add your business information, and save the building blocks to use again.

How To: Download a Free, 30-Day Trial of Office for Mac 2011
If you're a Mac user, it's fair to assume that you may be a little skeptical when it comes to Microsoft products. Microsoft knows this, of course. Which is why the company has decided to offer Mac users a free, one-month trial of the latest version of their popular Office productivity suite, Microsoft Office for Mac 2011. They're betting you'll like it so much you'll buy it. And, if you're already a Office for Mac 2008 user, they may be right! Think you're tough enough to resist Steve Ballmer...
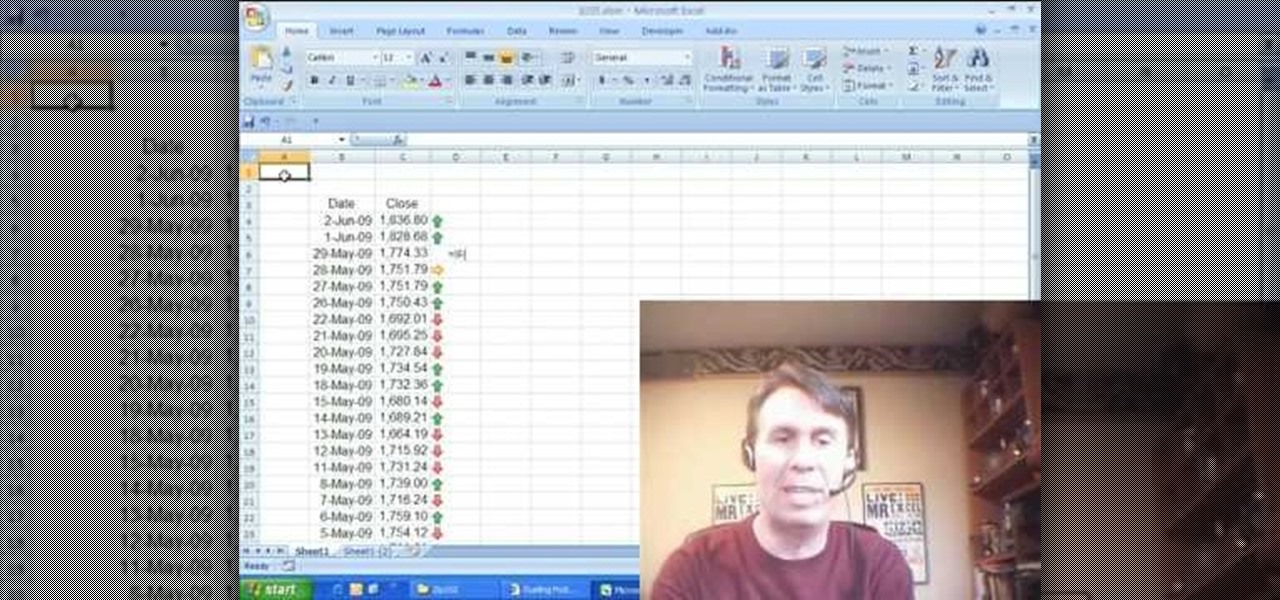
How To: Display trend arrows in a Microsoft Excel spreadsheet
New to Microsoft Excel? Looking for a tip? How about a tip so mind-blowingly useful as to qualify as a magic trick? You're in luck. In this MS Excel tutorial from ExcelIsFun and Mr. Excel, the 14th installment in their joint series of digital spreadsheet magic tricks, you'll learn how to create formulas and Conditional Formatting that will display UP, DOWN, and SIDE arrows to indicate up or down for a list of numbers.
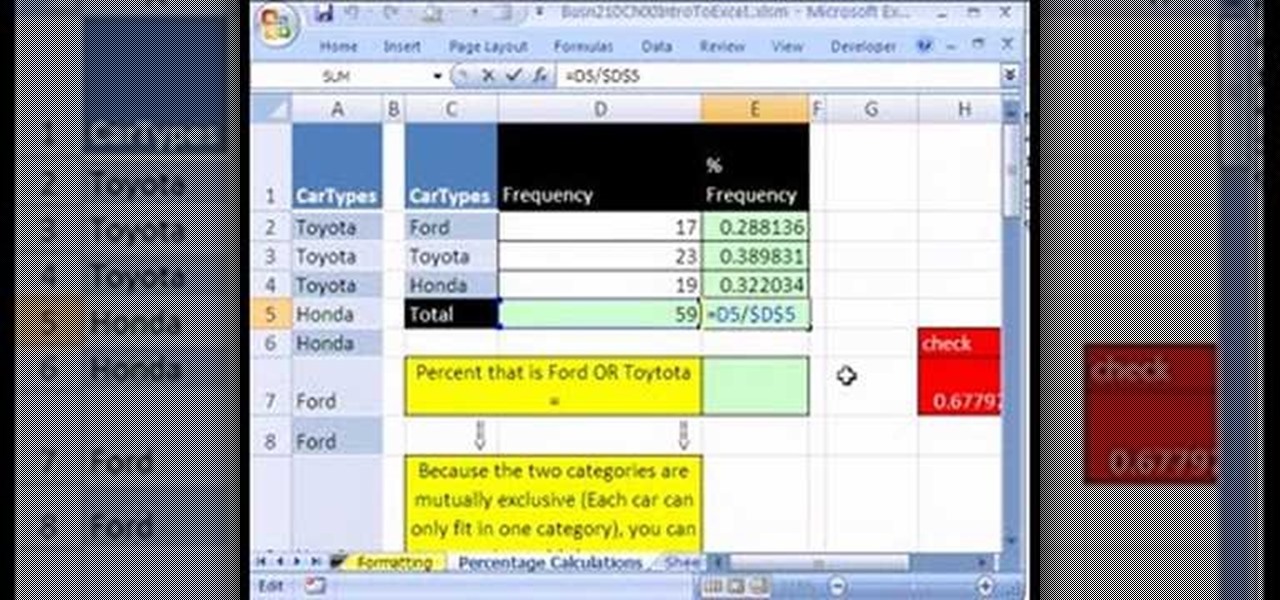
How To: Calculate proportions and percentages in Excel
This Excel Statistics series of video shows how to calculate proportions and percentages in Microsoft Excel. This video shows how to do percentage calculations using formulas in Microsoft Excel. To make a formula for a percentage, you need to first make a formula to calculate the total sum of objects you are going to use. To do that, use the sum formula. Now, divide the current object's value with the previously generated sum formula, which gives you the frequency. When you multiply this by 1...
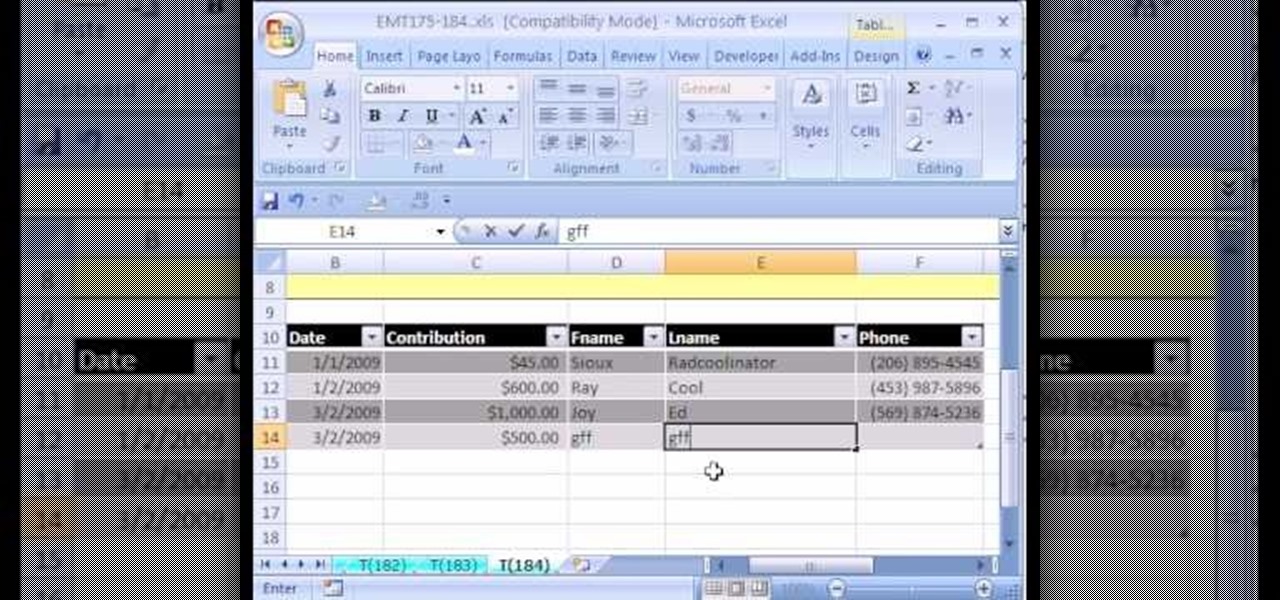
How To: Create a simple database in Excel with a list or table
New to Microsoft Excel? Looking for a tip? How about a tip so mind-blowingly useful as to qualify as a magic trick? You're in luck. In this MS Excel tutorial from ExcelIsFun, the 168th installment in their series of digital spreadsheet magic tricks, you'll learn how to create a simple dynamic database in Excel using lists in Excel 2003 and tables in 2007.

How To: Create a line chart with time as its x-axis in Excel
New to Microsoft Excel? Looking for a tip? How about a tip so mind-blowingly useful as to qualify as a magic trick? You're in luck. In this MS Excel tutorial from ExcelIsFun, the 284th installment in their series of digital spreadsheet magic tricks, you'll learn how to create a line chart from years and percentage change. See how Excel makes the chart wrong, but then see how to fix it.

How To: Find range and interquartile range in Microsoft Excel
If you use Microsoft Excel on a regular basis, odds are you work with numbers. Put those numbers to work. Statistical analysis allows you to find patterns, trends and probabilities within your data. In this MS Excel tutorial from everyone's favorite Excel guru, YouTube's ExcelsFun, the 40th installment in his "Excel Statistics" series of free video lessons, you'll learn how to calculate range & interquartile range for variability using the MAX, MIN, QUARTILE functions.
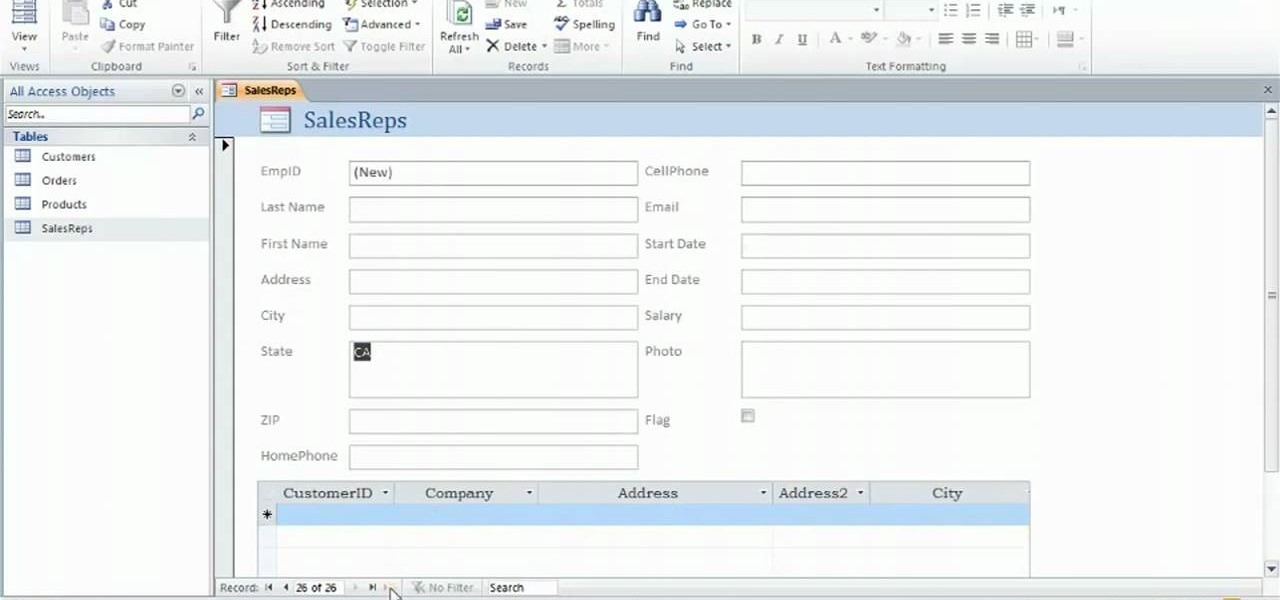
How To: Creating data-entry forms in Microsoft Access 2010
Learn how to create data-entry forms when working in Microsoft Access 2010. Whether you're new to Microsoft's popular database management application or a seasoned MS Office professional just looking to better acquaint yourself with the Access 2010 workflow, you're sure to be well served by this video tutorial. For more information, and to get started using data-entry forms in your own Access projects, watch this free video guide.
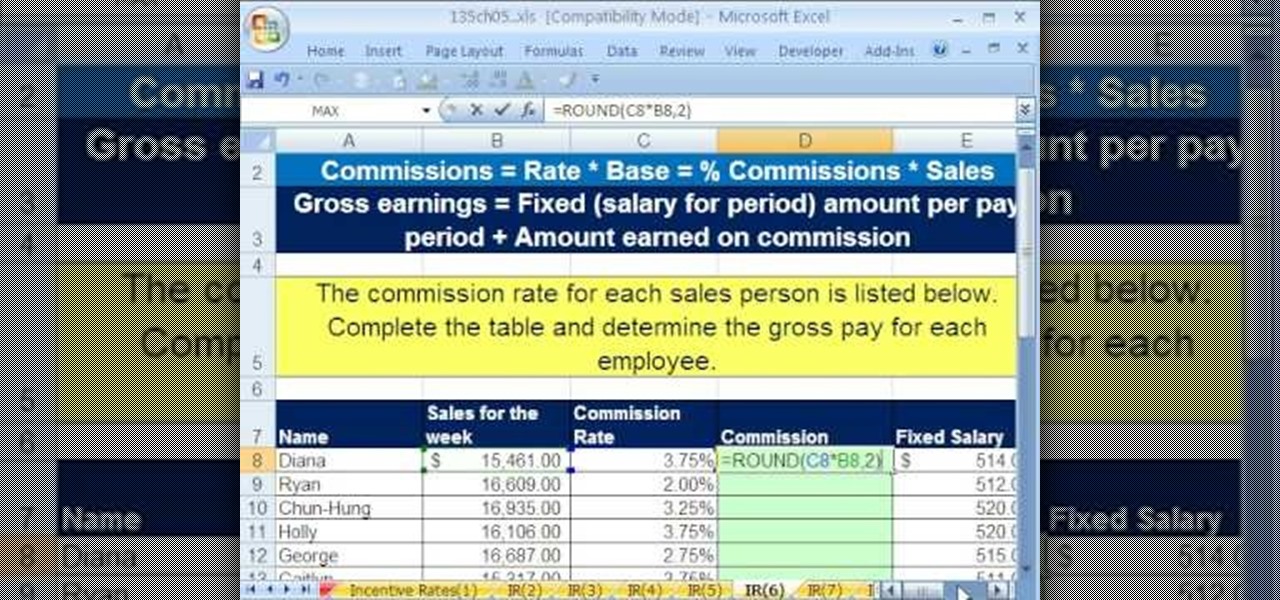
How To: Calculate incentive rates by formula in MS Excel
As you might guess, one of the domains in which Microsoft Excel really excels is business math. Brush up on the stuff for your next or current job with this how-to. In this tutorial from everyone's favorite digital spreadsheet guru, YouTube's ExcelIsFun, the 39th installment in his "Excel Business Math" series of free video lessons, you'll learn how to calculate (piecework/comission) incentive rates by Excel formula.
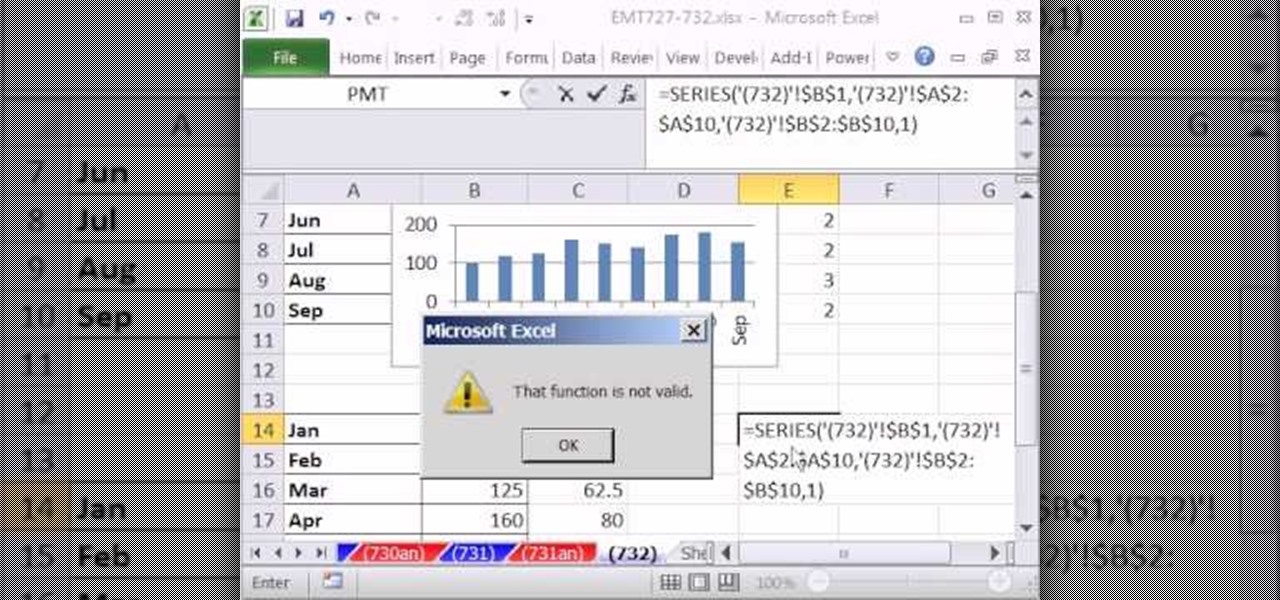
How To: Use the SERIES chart function in Microsoft Excel 2010
New to Microsoft Excel? Looking for a tip? How about a tip so mind-blowingly useful as to qualify as a magic trick? You're in luck. In this MS Excel tutorial from ExcelIsFun, the 732nd installment in their series of digital spreadsheet magic tricks, you'll learn how to make use of the Excel SERIES chart function.
How To: Turn off AutoCorrect symbols in Excel
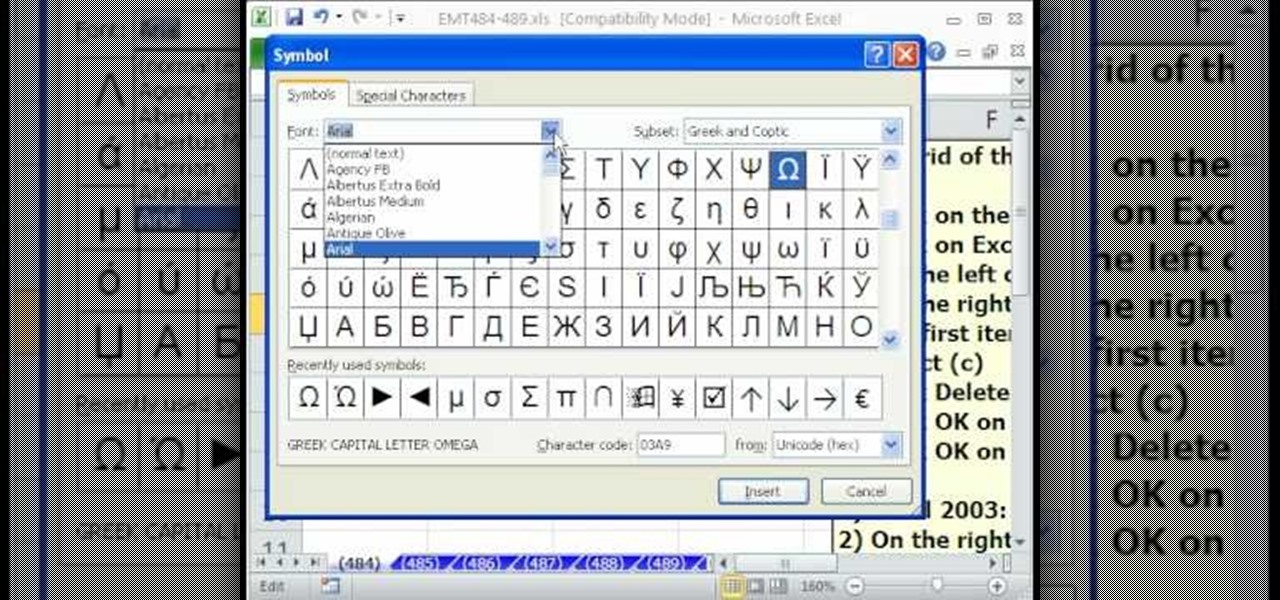
In this Excel magic trick video the instructor shows how to stop automatic copyright symbol ©. While using Microsoft Excel when you type the letter c in between a pair of curved braces Excel automatically turns it into the copy symbol © even if we did not intend to use it. Now to get rid of this feature go to the file menu and then to the options menu. In the options window that pops up go to the proofing sub menu and there is a button for auto correct options. Go into it and it shows the lis...
How To: Calculate variance and standard deviation using Excel
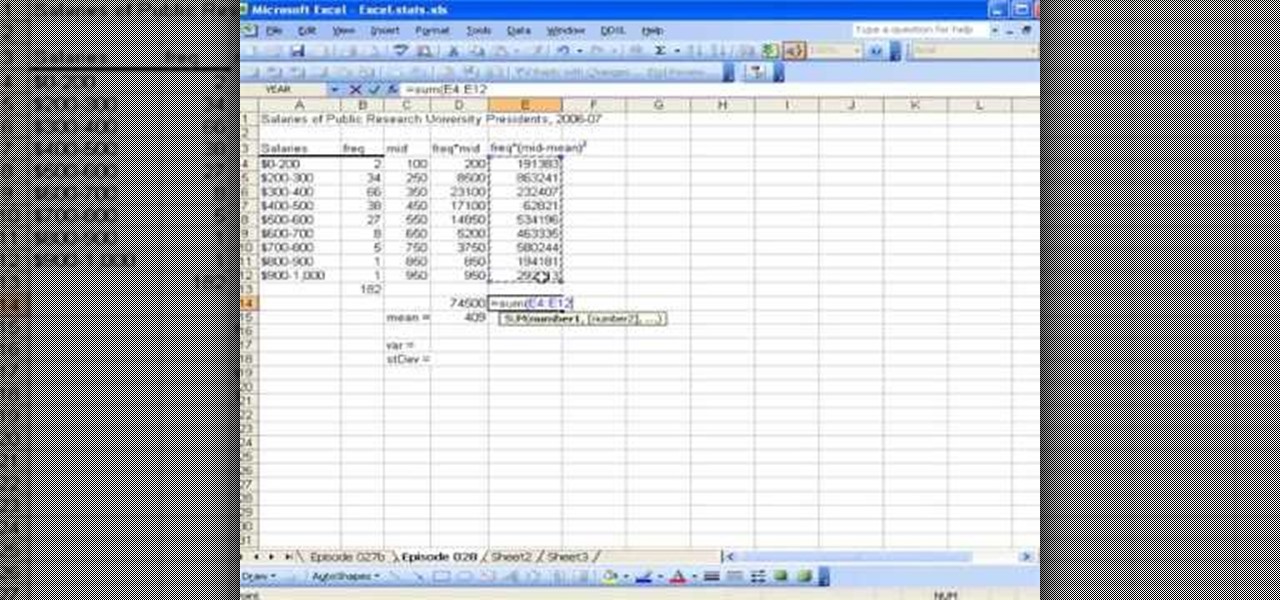
This video shows the method to find the variance and standard deviation using Excel. The variance shows the variability of the data points from the median. We find the difference of the median and the mean. We write the formula using '=' sign. The median and data points are put in it by selecting the appropriate cell. The median is made an absolute constant by pressing the F4 key. This is squared by using '^2'. This is multiplied to the frequency using '*'. The result is found for all the dat...
How To: Completely hide the Ribbon menu in Excel
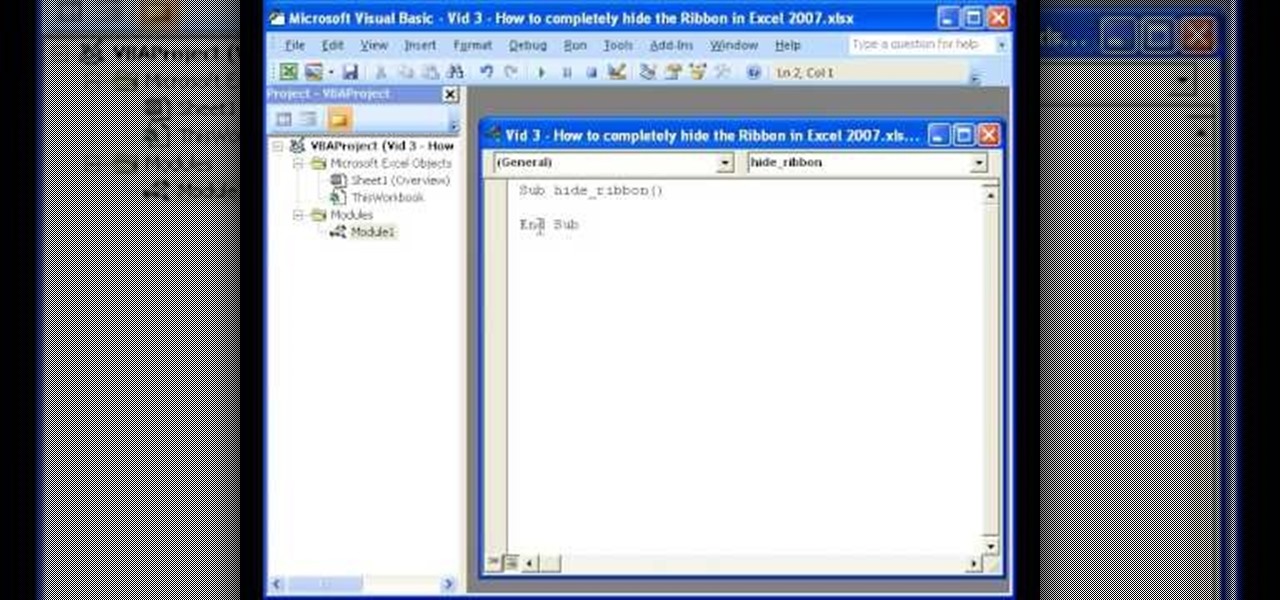
The instructor of this video shows you how to completely hide the ribbon, or the menu, in Excel. If you only want to partially hide the ribbon, you can use the shortcut control + F1. To completely hide the ribbon, though, go to the Visual Basic screen, hit Alt + F11. Then, go to insert, then module, and type in the macro "sub (Your name for macro)" then hit enter, then type in the code "application.executeExcel4macro''show.toolbar(""Ribbon"", false)''". To set up the code to show the ribbon a...
How To: Create a line chart in Microsoft Excel 2011
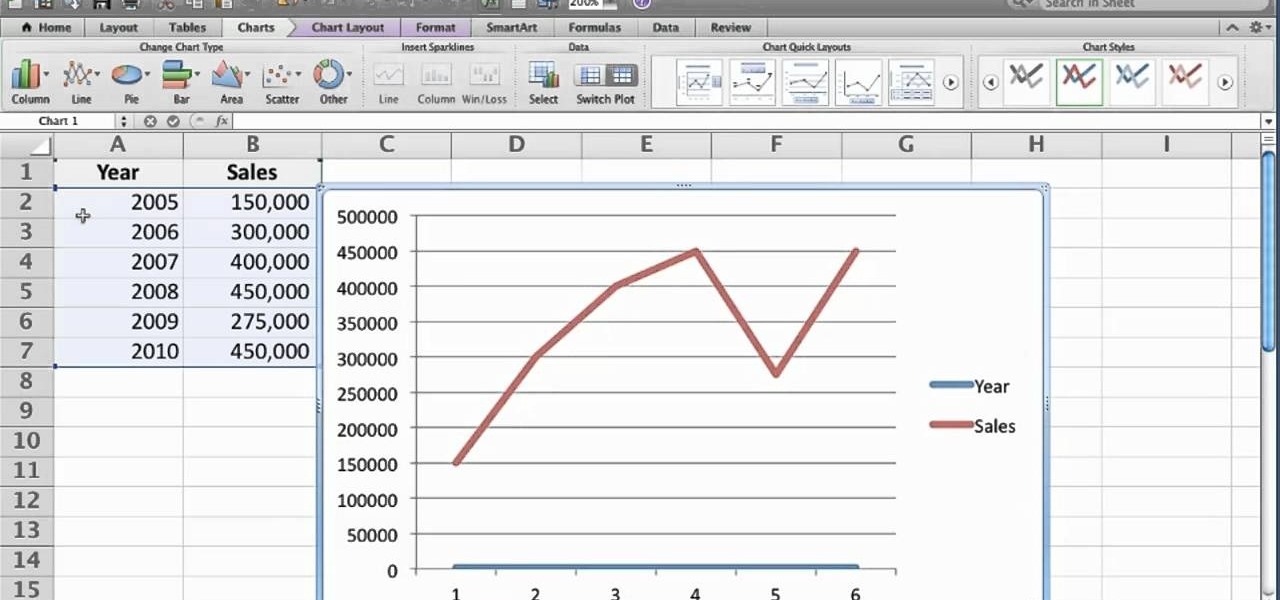
Want to generate a line chart in Excel 2011? This video will show you how it's done. Whether you're new to Microsoft's popular digital spreadsheet application, new to Excel 2011 or even an expert merely looking to brush up on the fundamentals, you're sure to be well served by this quality video tutorial from the folks at Lynda. For all of the details, and to get started creating and using line charts to visualize data in your own MS Excel '11 projects, watch the video.
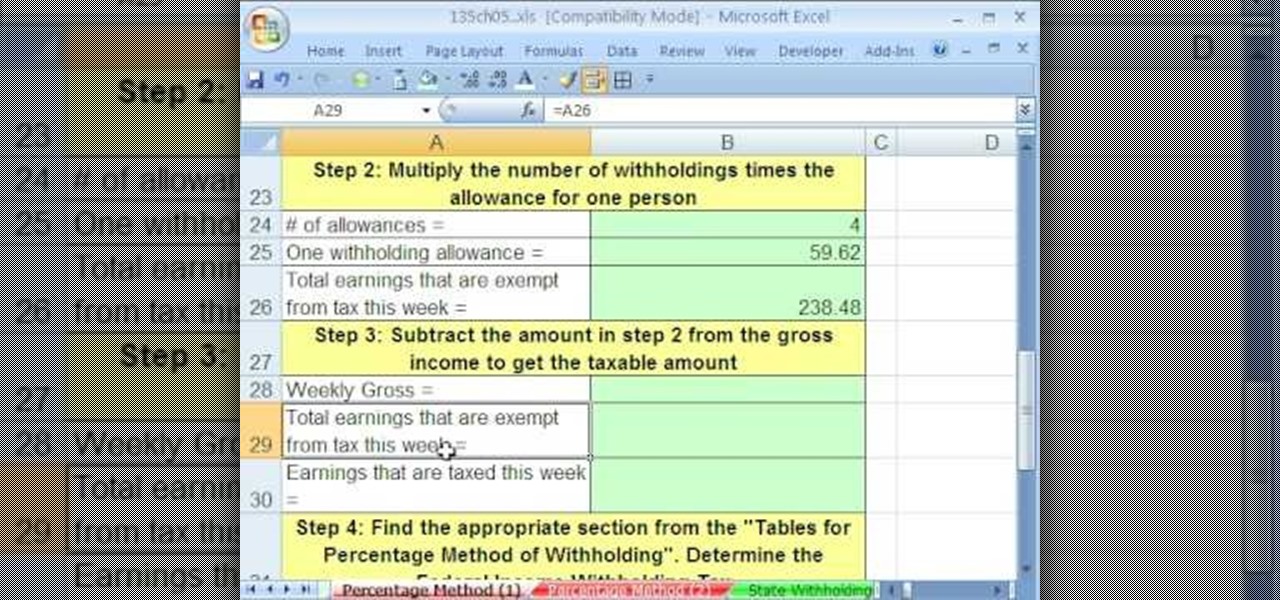
How To: Calculate income tax payroll deductions in MS Excel
As you might guess, one of the domains in which Microsoft Excel really excels is business math. Brush up on the stuff for your next or current job with this how-to. In this tutorial from everyone's favorite digital spreadsheet guru, YouTube's ExcelIsFun, the 42nd installment in his "Excel Business Math" series of free video lessons, you'll learn about the wage bracket and percentage methods for calculating federal income tax payroll deductions.

How To: Make distributions, ogive charts & histograms in Excel
If you use Microsoft Excel on a regular basis, odds are you work with numbers. Put those numbers to work. Statistical analysis allows you to find patterns, trends and probabilities within your data. In this MS Excel tutorial from everyone's favorite Excel guru, YouTube's ExcelsFun, the 22nd installment in his "Excel Statistics" series of free video lessons, you'll learn how to create a percent (%) cumulative frequency distribution with formulas, a histogram and an ogive chart. See how to add ...
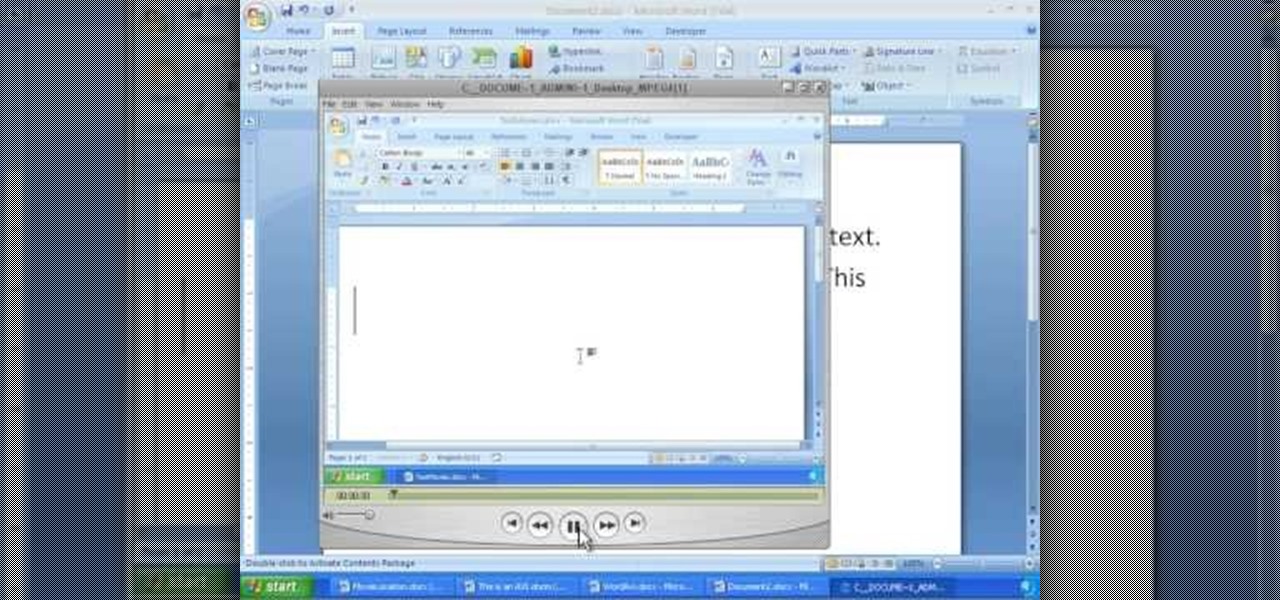
How To: Insert movie files into a MS Word document
In order to insert movies into Microsoft Word 2007, Click on Insert. For AVI, go to Object, Create From File, and select the location of the file. Then, click on Insert. It will now appear on your document. The video should play. The video can be repositioned or adjusted. It can be saved with your document, although this is not true for other movie formats.

How To: Create a scatter diagram for 2 variables in Excel
If you use Microsoft Excel on a regular basis, odds are you work with numbers. Put those numbers to work. Statistical analysis allows you to find patterns, trends and probabilities within your data. In this MS Excel tutorial from everyone's favorite Excel guru, YouTube's ExcelsFun, the 30th installment in his "Excel Statistics" series of free video lessons, you'll learn how to create a scatter diagram for 2 quantitative variables.

How To: Convert a formula to a value in Microsoft Excel 2010
Learn how to convert a formula to a value in a Microsoft Excel 2010 spreadsheet. Whether you're new to Microsoft's popular digital spreadsheet application or a seasoned business professional just looking to better acquaint yourself with the Excel 2010 workflow, you're sure to be well served by this video tutorial. For more information, and to get started converting formulas in your own MS Excel 2010 projects, watch this free video guide.

How To: Score a Full Version of Microsoft Office for Only $10
When it comes to text documents and spreadsheets, Microsoft Office is the be-all and end-all office suite—but it's not cheap. Paying anywhere from $140 to $400 puts a big dent in your bank account, especially if you're a broke college student eating ramen for breakfast, lunch, and dinner. Something that I wish I would've known about during college is Microsoft's HUP (Home Use Program). With HUP, any employee or student of an organization that has a Microsoft volume license is eligible to purc...

How To: Wrap text around pictures in Microsoft Word: Mac 2008
Add pictures always seems to mess up your document— but not anymore. In Word 2008 for Mac, adding photos doesn't have to be stressful. Words and pictures can coexist beautifully now. The Microsoft Office for Mac team shows you just how to make text wrap around pictures in this how-to video. They will look and fit better, and your words can be friends now with your added images.

How To: Link two (multiple) workbooks & cells in Excel
In this tutorial, we learn how to link two workbooks and cells in Excel. First, save both of the files that you want to link together. Make sure you only have one Excel window open, then double click the other Excel file, don't open separately. Next, type in the equals sign into the "A" column, then to go the window menu and you will be able to see all the Excel files currently open. Now, click "link" and you will be taken back to the original worksheet. Now, you will be linked to the other n...

How To: Calculate the coefficient of variation (CV) in Excel
If you use Microsoft Excel on a regular basis, odds are you work with numbers. Put those numbers to work. Statistical analysis allows you to find patterns, trends and probabilities within your data. In this MS Excel tutorial from everyone's favorite Excel guru, YouTube's ExcelsFun, the 42nd installment in his "Excel Statistics" series of free video lessons, you'll learn how to calculate the coefficient of variation.
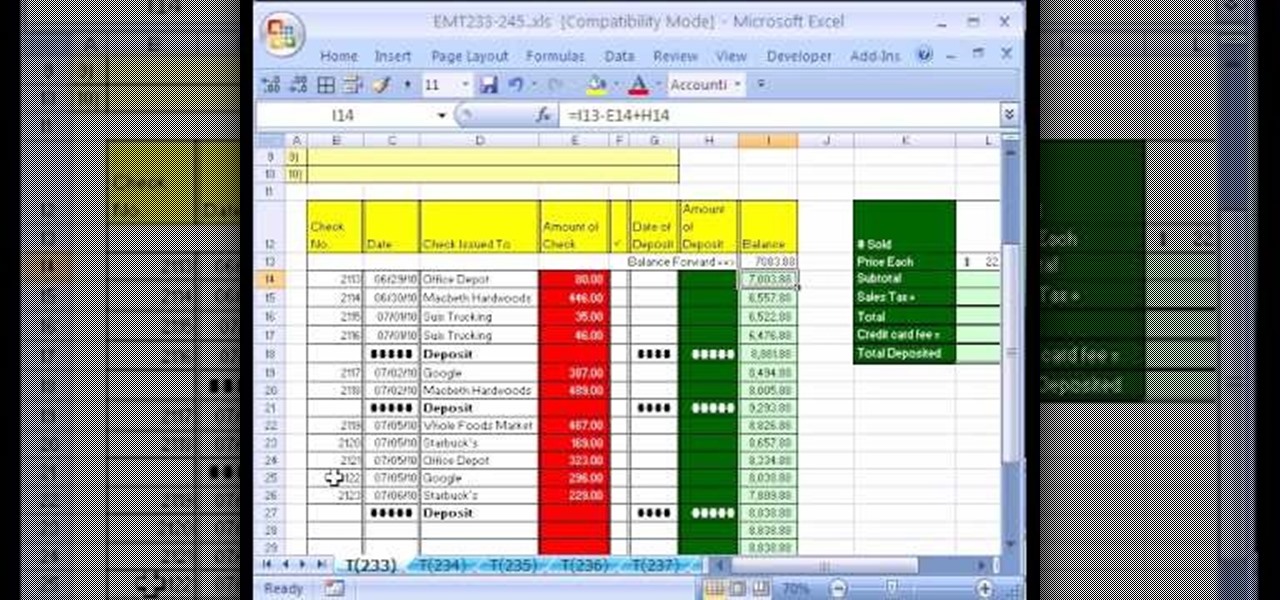
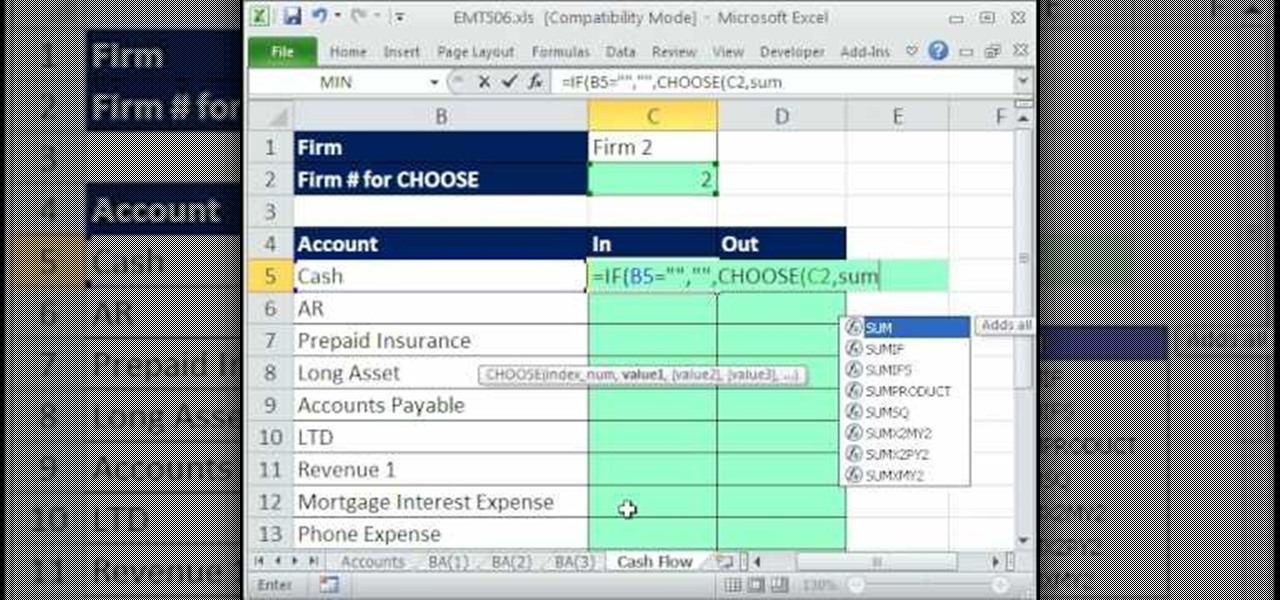
How To: Create a checkbook-balancing formula in Excel
New to Microsoft Excel? Looking for a tip? How about a tip so mind-blowingly useful as to qualify as a magic trick? You're in luck. In this MS Excel tutorial from ExcelIsFun, the 233rd installment in their series of digital spreadsheet magic tricks, you'll learn how to create an efficient checkbook balance formula and see when to use the ROUND function on a sales invoice.

How To: Create a histogram-like display in Excel 2008 for OSX
Here is how to make a histogram-like display in Excel 2008 for OSX. Note that you have to right click on the actual bars in the graph to get the menu to come up. If you work on a Mac and need to use Excel 2008 to make histograms, then watch this MS Office tutorial.
How To: Use Visual Basic macros in Microsoft Excel: Mac 2008
Oh, no! Visual Basic macros are no longer supported in Excel 2008 for Mac, which might make things a little difficult for you if you're used them a lot in the past, or if somebody else gives you spreadsheets using them. The Microsoft Office for Mac team shows you just how to deal with Visual Basic macros in this how-to video.
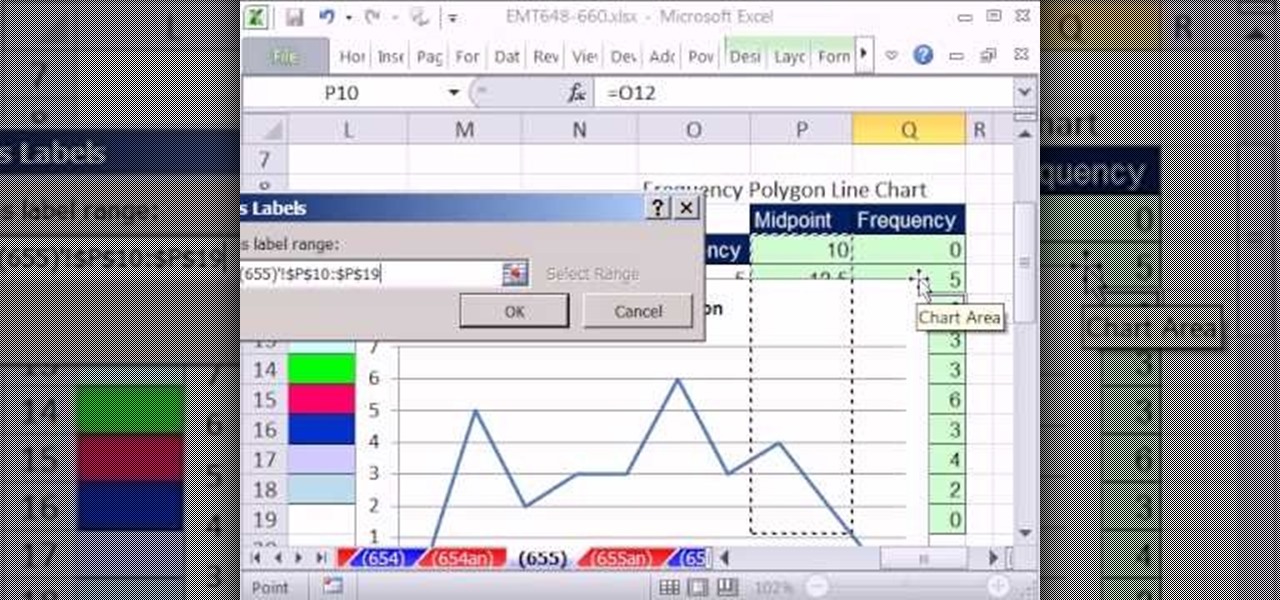
How To: Create a frequency polygon line chart in MS Excel
New to Microsoft Excel? Looking for a tip? How about a tip so mind-blowingly useful as to qualify as a magic trick? You're in luck. In this MS Excel tutorial from ExcelIsFun, the 655th installment in their series of digital spreadsheet magic tricks, you'll learn see how to create a statistical frequency polygon using a line chart. Also see how Excel mistakenly interprets number category label data as Number Series data.
How To: Use the Advanced Filter tool to extract data in Excel
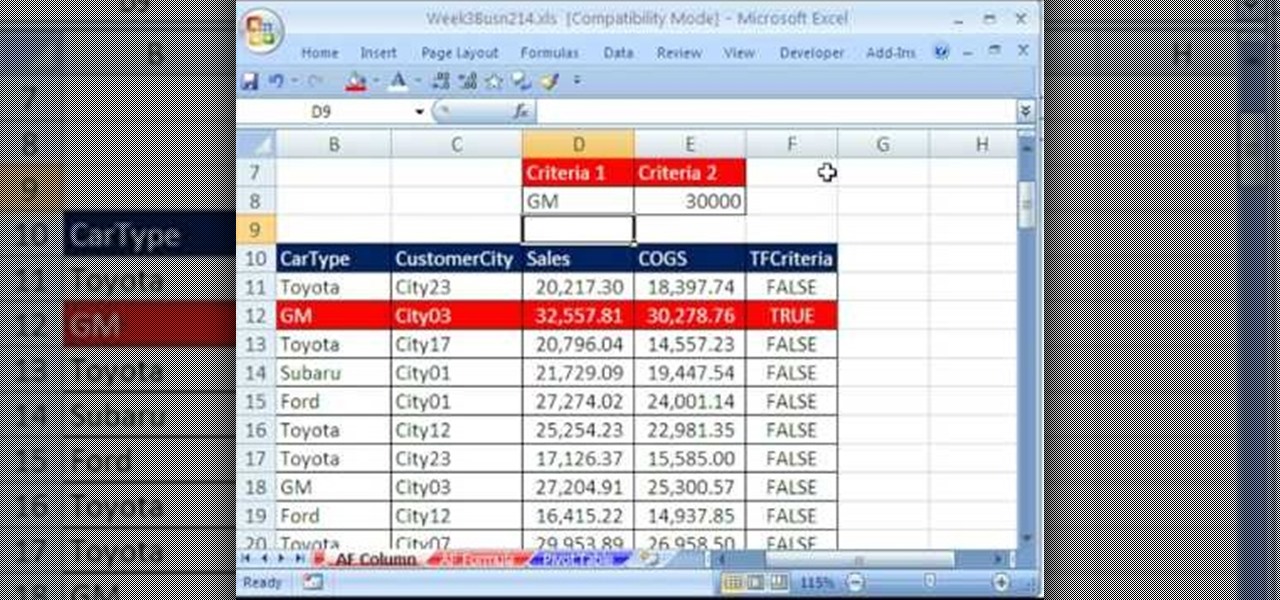
Whether you're interested in learning Microsoft Excel from the bottom up or just looking to pick up a few tips and tricks, you're in the right place. In this tutorial from everyone's favorite digital spreadsheet guru, ExcelIsFun, the 19th installment in his "Highline Excel Class" series of free video Excel lessons, you'll learn about using Advanced Filter to extract data from an Excel List/Table/Database. See these 7 Advanced Filter examples:
How To: Create frequency distributions with Excel pivot tables
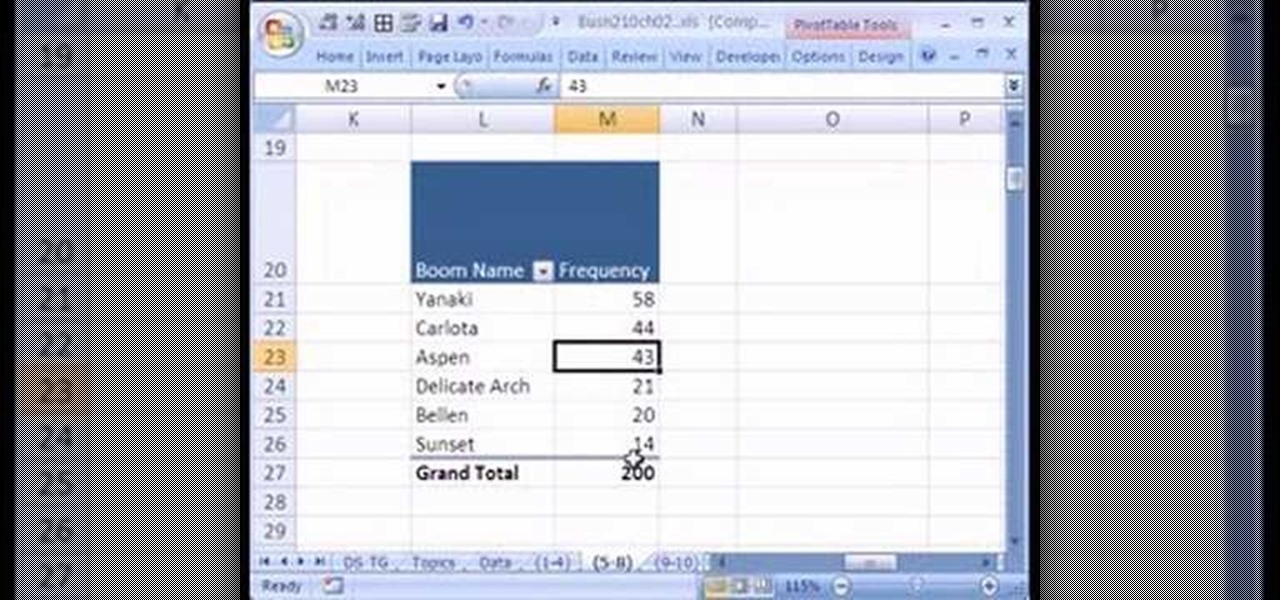
If you use Microsoft Excel on a regular basis, odds are you work with numbers. Put those numbers to work. Statistical analysis allows you to find patterns, trends and probabilities within your data. In this MS Excel tutorial from everyone's favorite Excel guru, YouTube's ExcelsFun, the 15th installment in his "Excel Statistics" series of free video lessons, you'll learn how to use create a frequency distribution, relative frequency distribution, percent frequency distribution and pie chart wi...

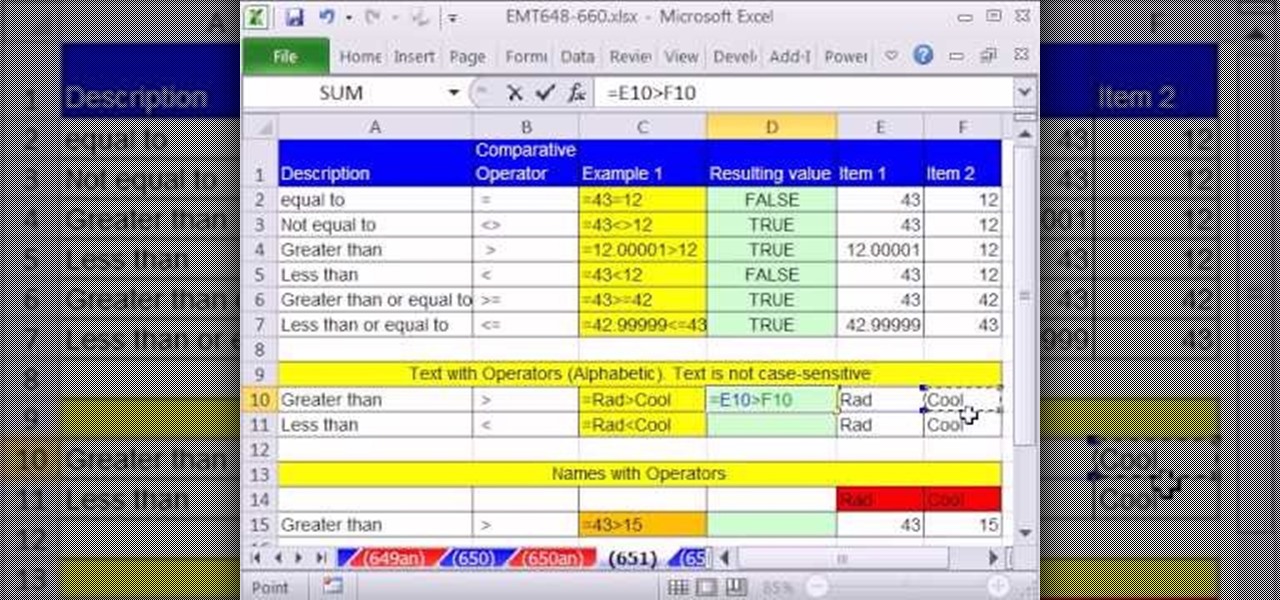
How To: Convert TRUE & FALSE values to 1 & 0 in MS Excel
New to Microsoft Excel? Looking for a tip? How about a tip so mind-blowingly useful as to qualify as a magic trick? You're in luck. In this MS Excel tutorial from ExcelIsFun, the 314th installment in their series of digital spreadsheet magic tricks, you'll learn four different methods for converting TRUE and FALSE values to 1 and 0 (zeroes).
How To: Create a monogram in MS Word
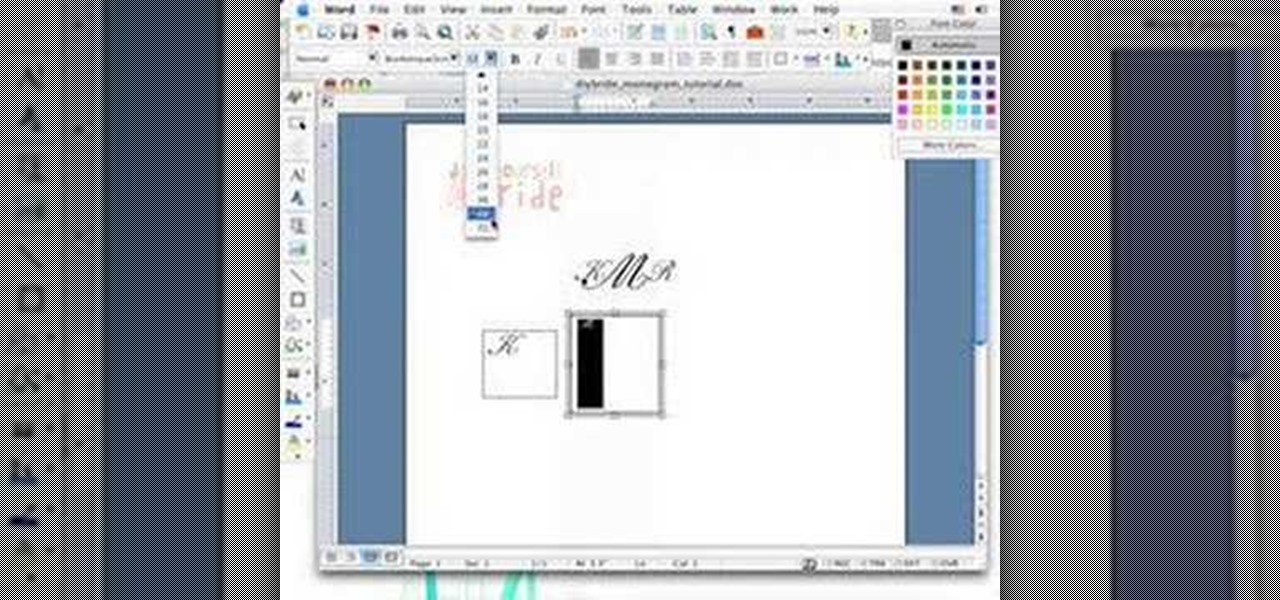
It's not as hard as you think to create your own monograms for your wedding invitations, napkins or whatever else you need. With so much needing to be controlled by others, just think how helpful it will be to have one more thing you can take care of yourself! See how to create monograms in MS Word.
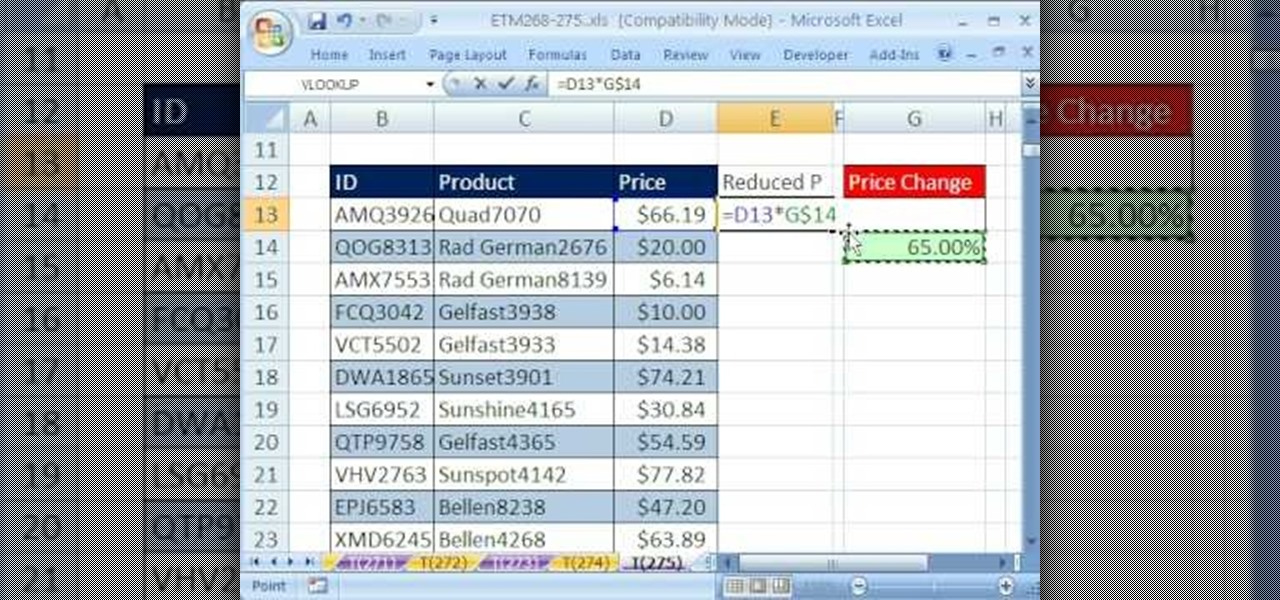
How To: Reduce a column of numbers by a percentage in Excel
New to Microsoft Excel? Looking for a tip? How about a tip so mind-blowingly useful as to qualify as a magic trick? You're in luck. In this MS Excel tutorial from ExcelIsFun, the 275th installment in their series of digital spreadsheet magic tricks, you'll learn how to reduce a column of numbers by a set percentage (in this case, 35%) quickly!

How To: Create quantitative data cross tabulation in MS Excel
If you use Microsoft Excel on a regular basis, odds are you work with numbers. Put those numbers to work. Statistical analysis allows you to find patterns, trends and probabilities within your data. In this MS Excel tutorial from everyone's favorite Excel guru, YouTube's ExcelsFun, the 29th installment in his "Excel Statistics" series of free video lessons, you'll learn how to create quantitative data cross tabulation using a pivot table (PivotTable).